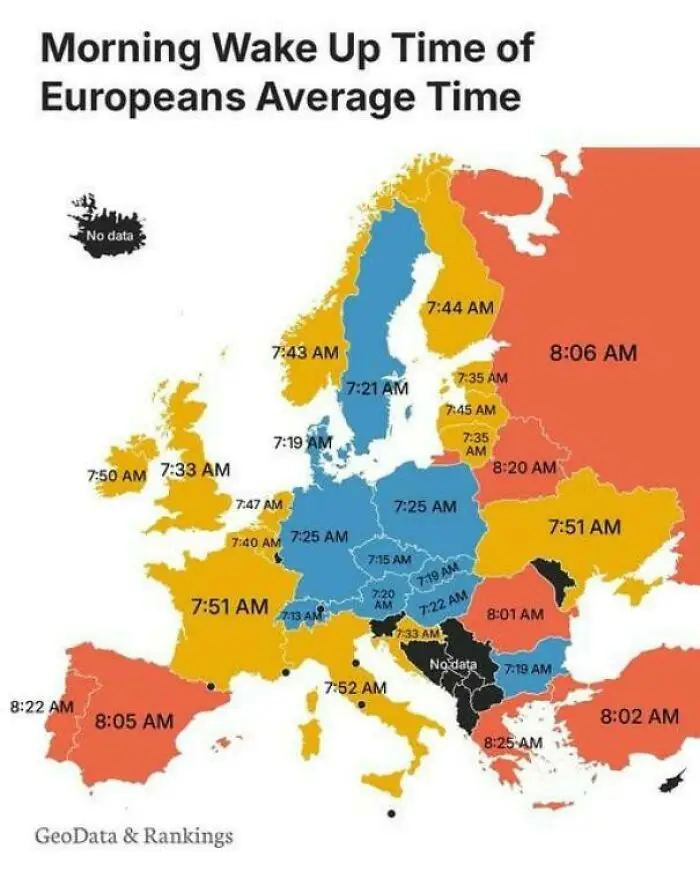
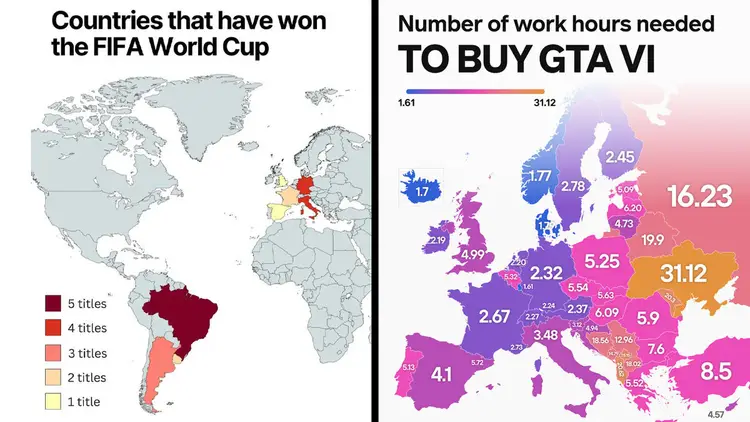




Bored Panda
99 Fascinating Maps That Explain The World Better Than Any Spreadsheet (New Pics)

99 Fascinating Maps That Explain The World Better Than Any Spreadsheet (New Pics)

37
1
Numbers and geography. Neither, as my family never tires of pointing out, is exactly my strong suit. A spreadsheet? My eyes glaze over instantly. Need directions? You’re better off staying home than listening to me. Maps, however, are a bit of a different story. Maybe it’s because a good map does the hard work for you. Take a pile of data that would normally send me running, add a few colors, and suddenly order is restored to the world (or at least the part of it on the map). And it’s not all navigation, either.
Turns out some maps even reveal all sorts of curiosities you never knew you wanted to know about, like which European countries use a comma instead of a decimal point, where it’s illegal to boil a lobster alive, or how many hours you’d have to work to buy GTA VI, depending on where you live. So whether you’re a geography buff or someone who, like me, still gets lost on the way to the shops, here are some of the most fascinating maps out there, plus some expert insight from Philippa Irvine, a geography lecturer at Rhodes University in South Africa.

#41 On The Longest Day Of The Year, The Sun Sets In Eastern Brazil Before Ireland
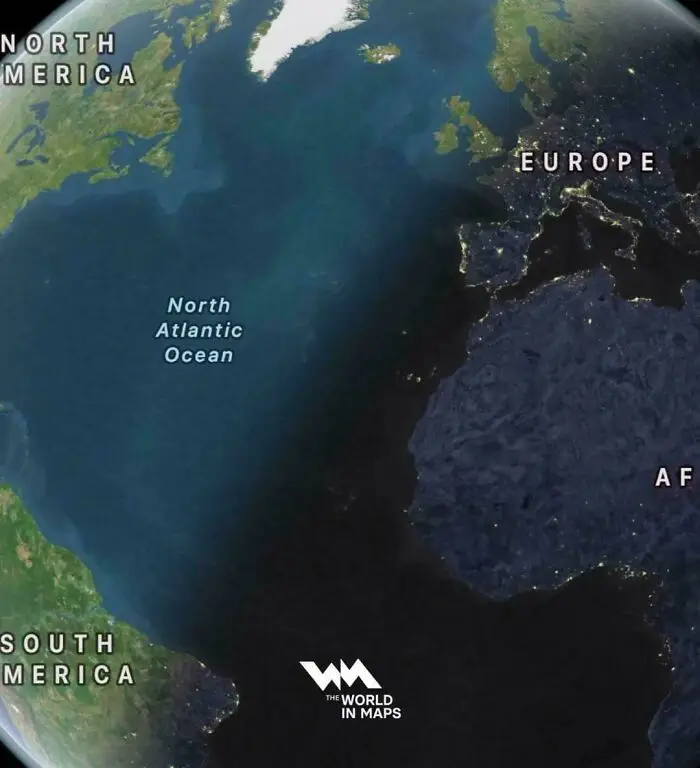
Satellite image of Atlantic Ocean night line between continents from fascinating maps that explain the world.
6points

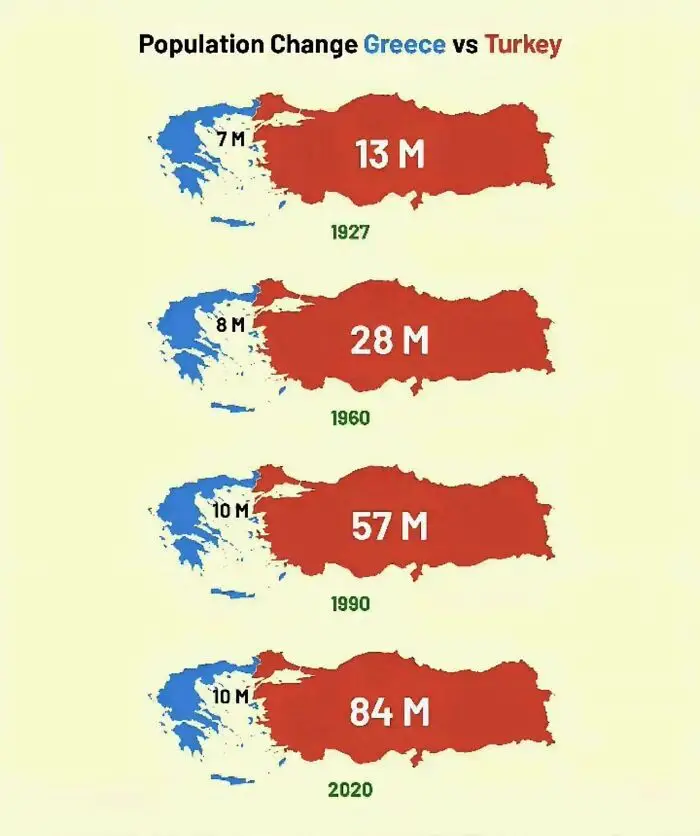
#42 Population Change In Greece & Turkey Over The Last Century

Infographic comparing population growth of Greece and Turkey over time among fascinating maps that explain the world.
Report
6points

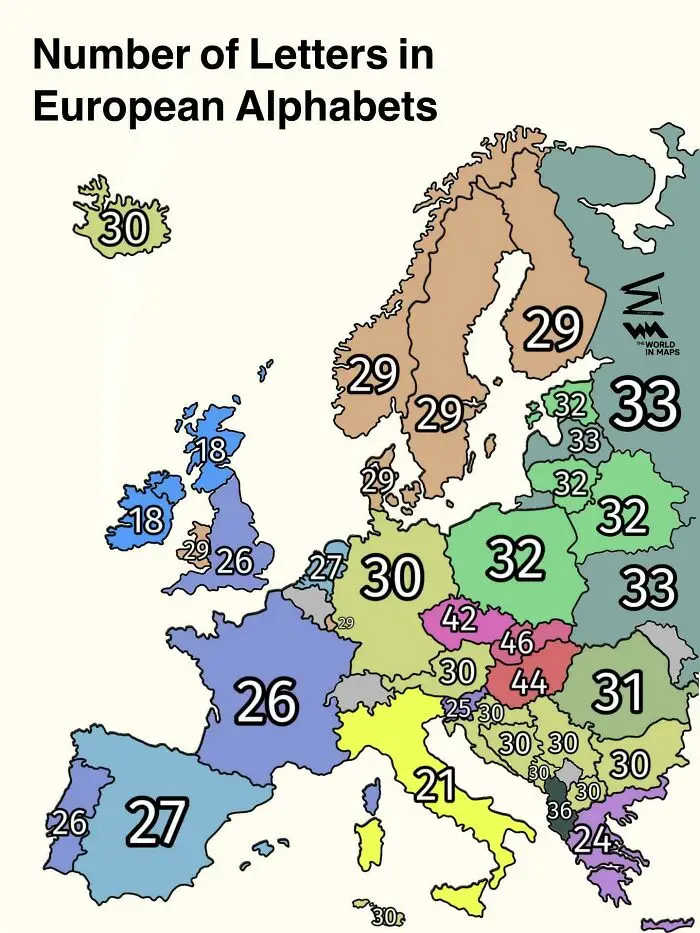
#43 Number Of Letters In European Alphabets

A map showing letter counts in European alphabets as part of fascinating maps that explain the world.
6points

#44 This Big Triangle In West Africa Is Completely Devoid Of Humans. No Towns Or Settlements. More Than 1/5 Of Mauritania's Land Area Is In This Triangle
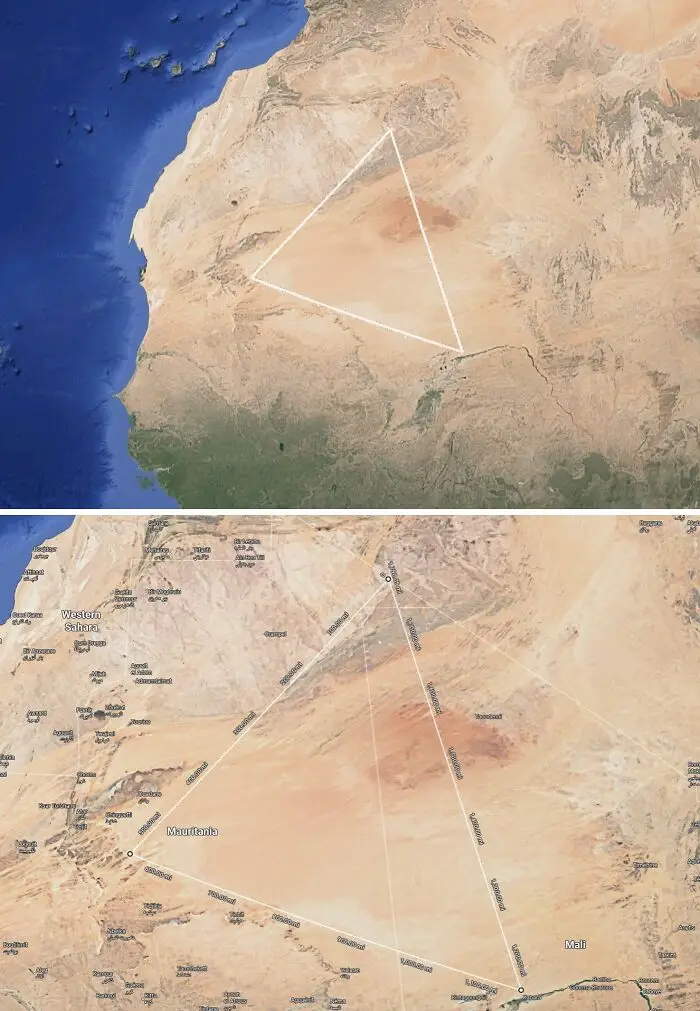
Satellite map outlining a massive geometric triangle drawn across the Sahara Desert in Africa.
6points

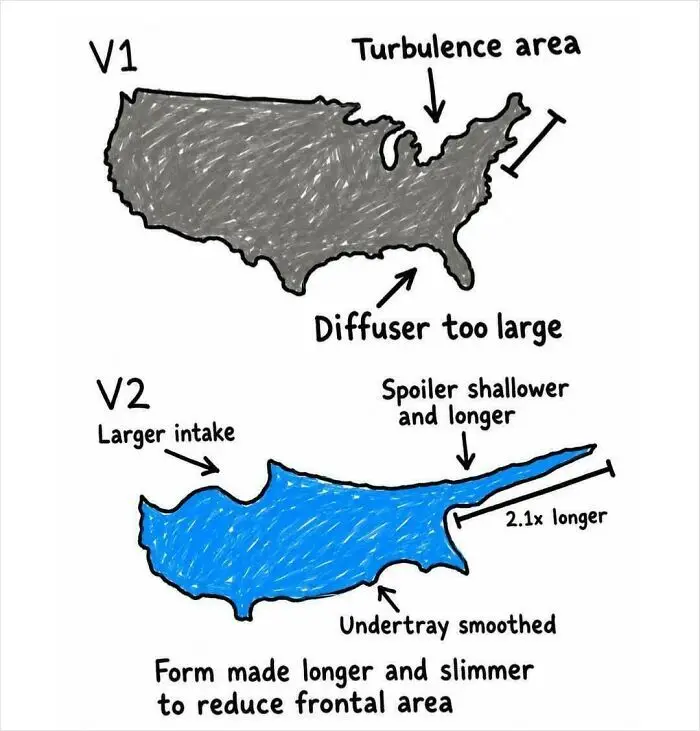
#45 Cyprus Is Just A More Aerodynamic Version Of The USA

Fascinating infographic comparing aerodynamic shapes of the USA and Cyprus to explain aerodynamic principles.
6points

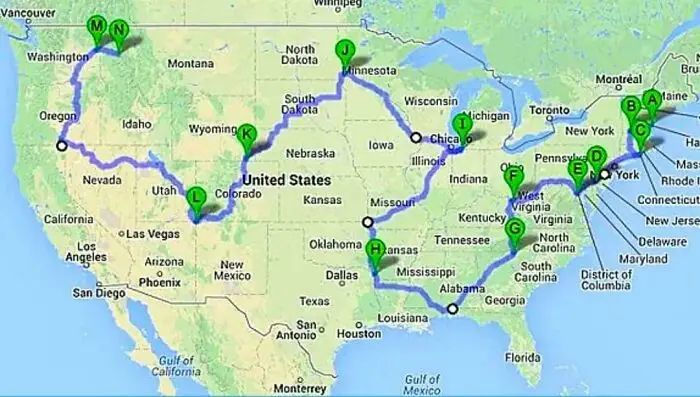
#46 The Shortest Driving Route Through All 48 Contiguous US States

A map of the United States displaying a complex road trip route across various states.
6points

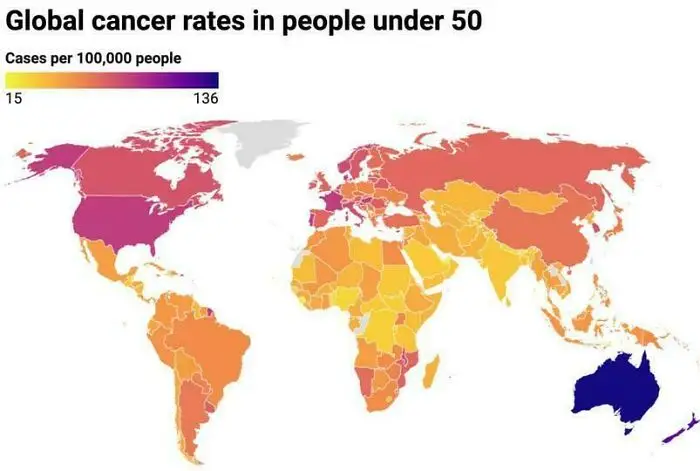
#47 Global Cancer Rates In People Under 50

A global map showing cancer rates in people under 50 years old.
6points

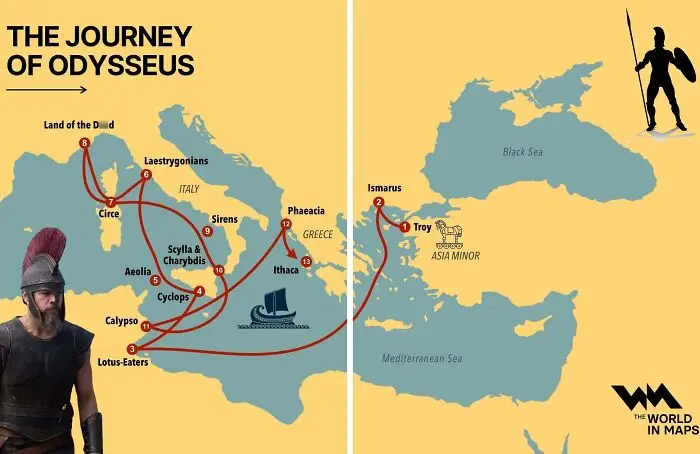
#48 The Journey Of Odysseus

A fascinating map illustrating the mythical journey of Odysseus across the Mediterranean Sea.
6points

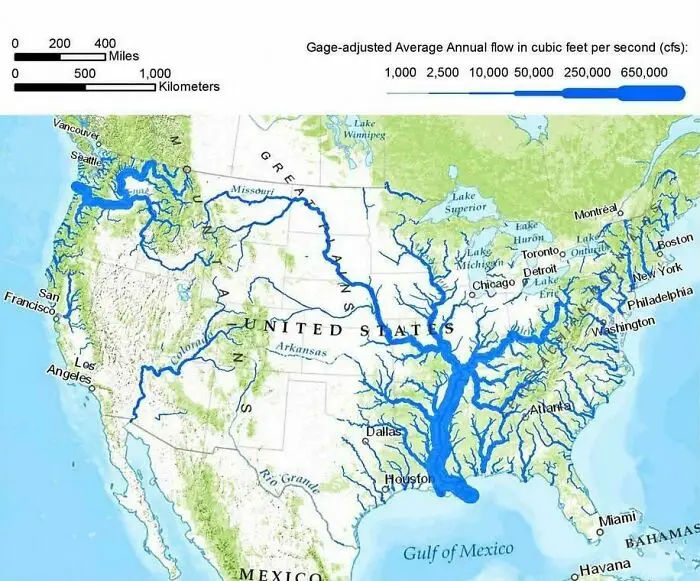
#49 US Rivers Drawn In Proportion To How Much Water They Carry

A map illustrating average annual river flow volume across the United States
6points

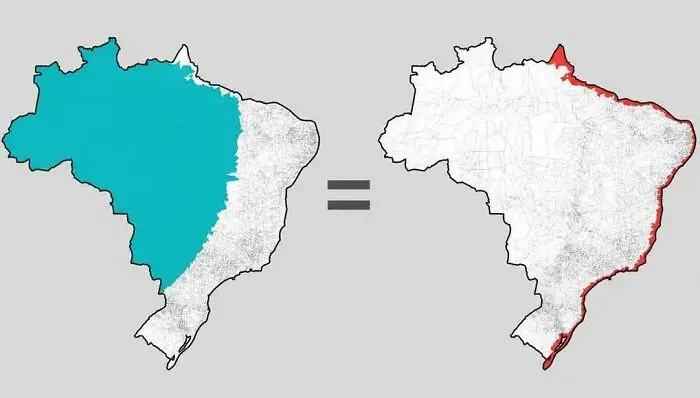
#50 The Same Number Of Brazilians Live In Each Highlighted Area

Fascinating maps illustration showing population density comparison between inland Brazil and its narrow coastline.
6points

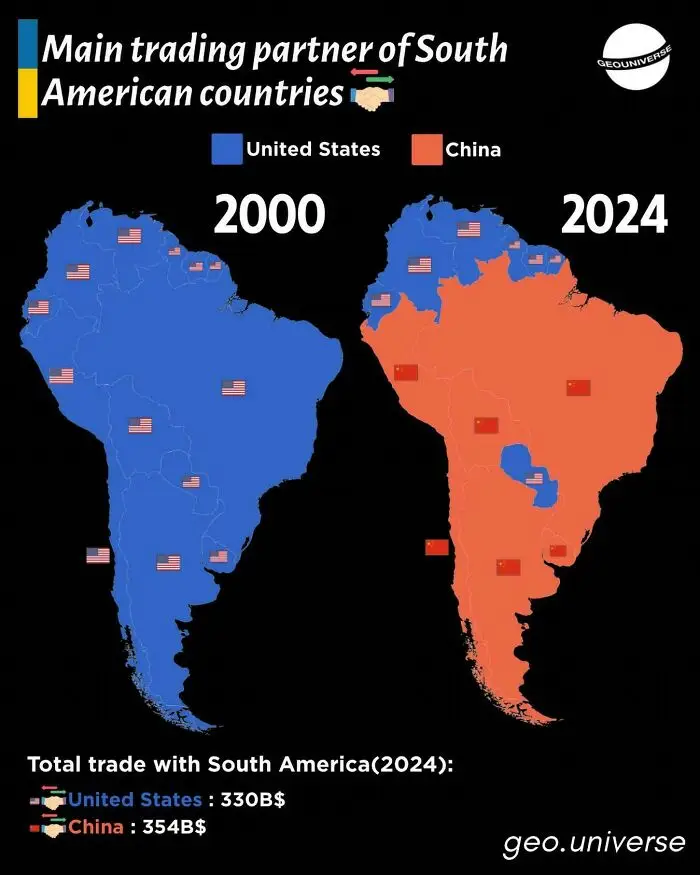
#51 Trading Partners Of South America

Comparison map of main trading partners in South America showing US vs China trade shifts, illustrating fascinating maps.
6points

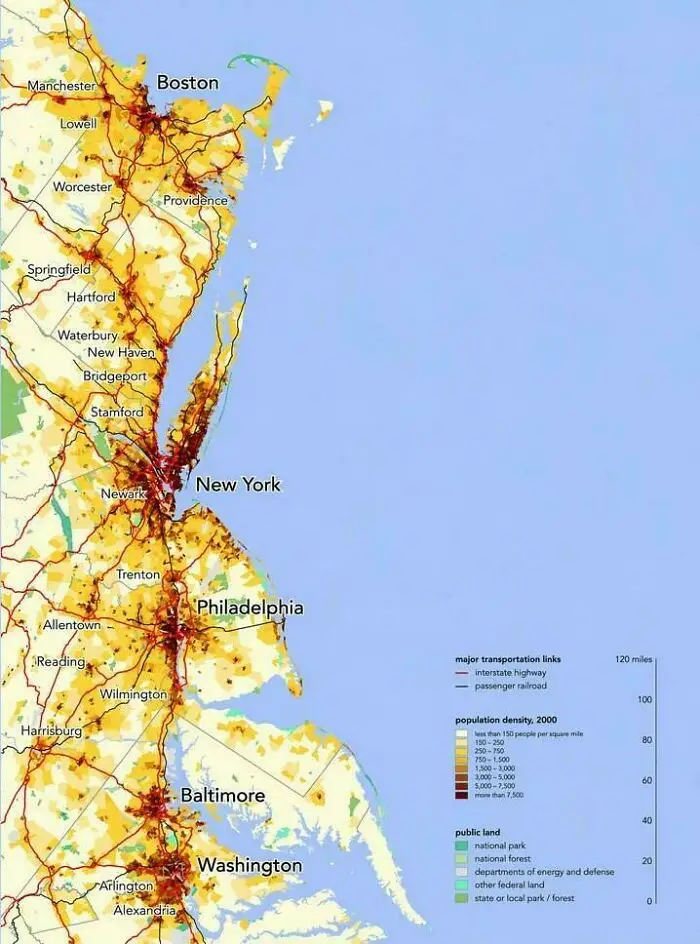
#52 The Northeast Megalopolis, Where A Sixth Of Americans Live

Population density map of the US East Coast showing fascinating maps of urban corridors from Boston to Washington DC.
6points

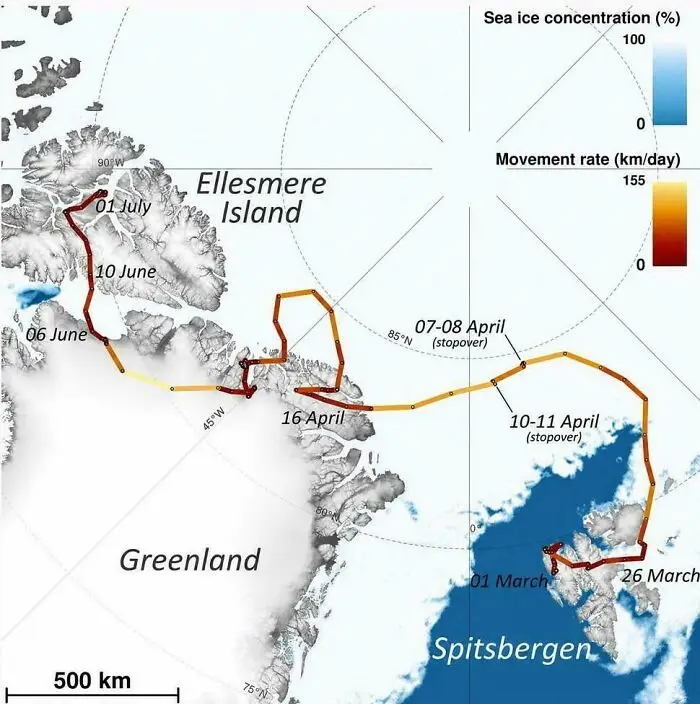
#53 An Arctic Fox Walked From Norway To Canada In 76 Days

A map tracking animal movement across Spitsbergen, Greenland, and Ellesmere Island over several months.
6points

#54 A Map Of The Temperatures South Asia Is Facing Right Now. It's So Hot That I Can't Even Stand Outside For Over 10 Minutes In The Afternoon
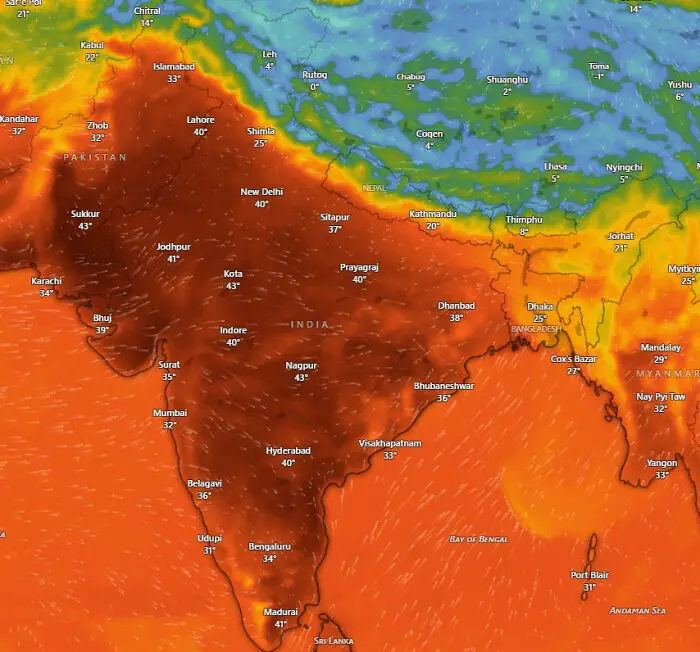
Detailed heat map showing temperatures across India and South Asia that explain the world better.
5points

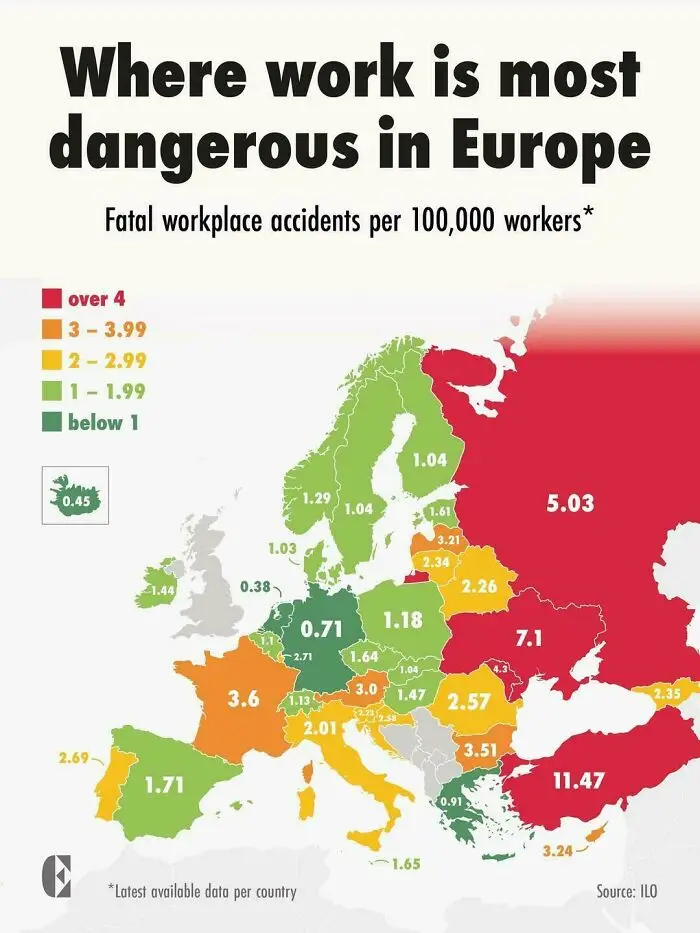
#55 Where Work Is Most Dangerous In Europe

Color coded map showing fatal workplace accidents rate in Europe that explain the world better.
5points

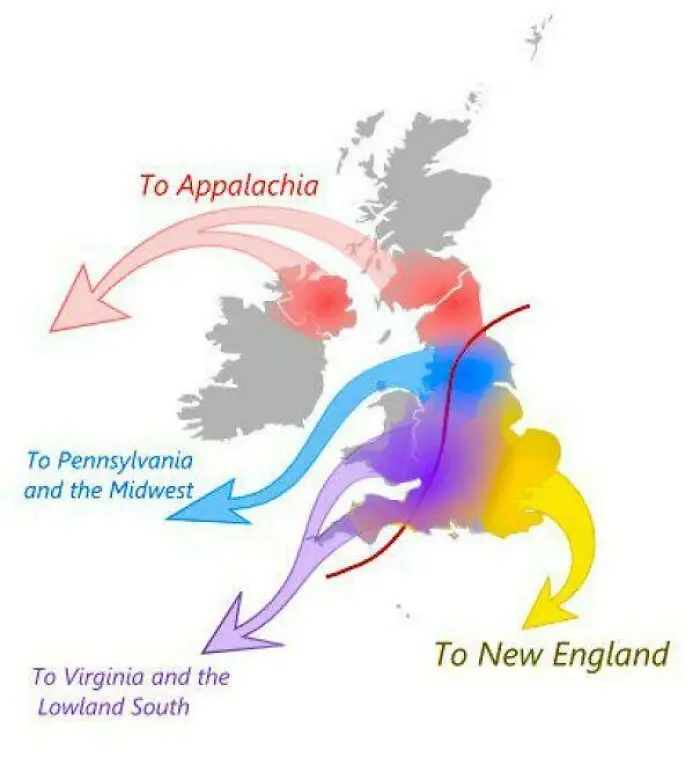
#56 The Migration Routes From Britain That Shaped Early America

Fascinating maps showing historical migration patterns from Great Britain to North America.
5points

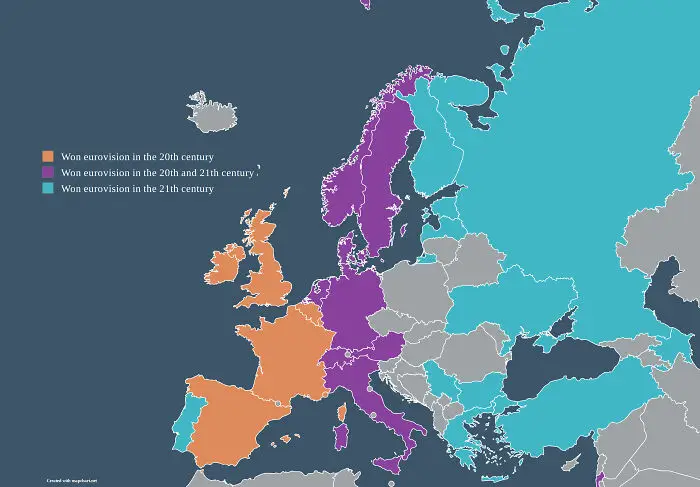
#57 Countries That Have Won Eurovision, Split By Century

A map of European countries color-coded by the century they won the Eurovision Song Contest.
5points

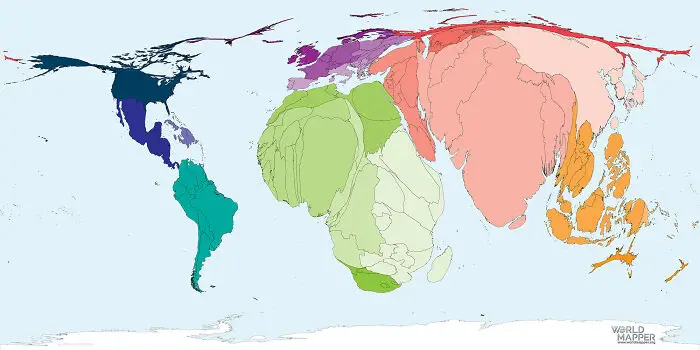
#58 World Map By Total Number Of Births

A distorted world map showing global land mass scaled according to specific data sets.
5points

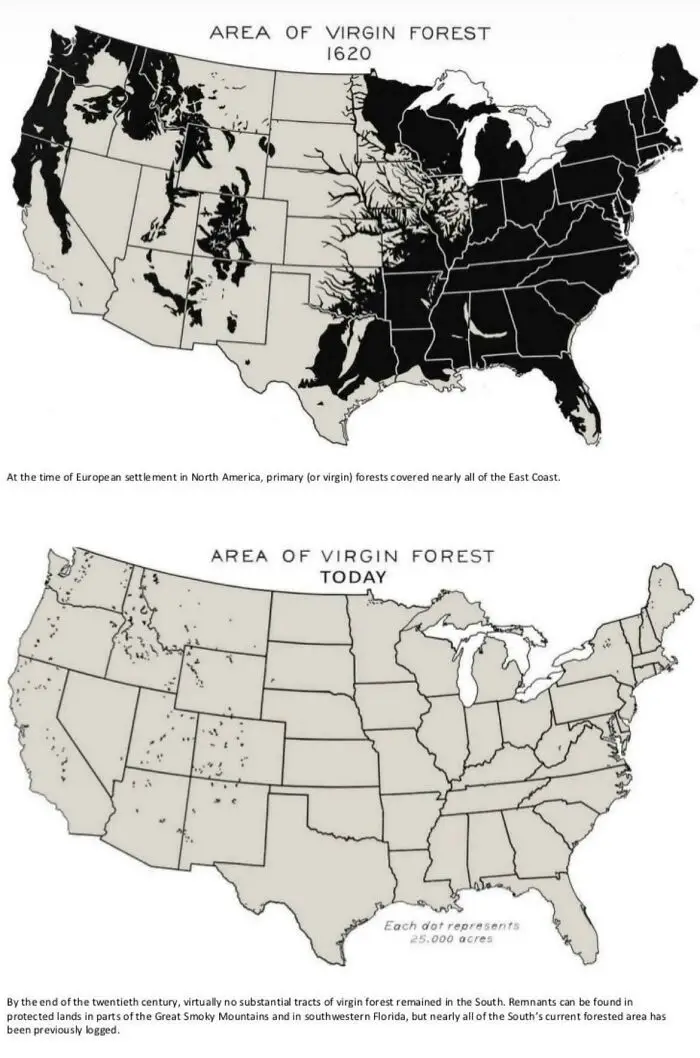
#59 Area Of US Virgin Forest In 1620 vs. Today

Comparison map showing the dramatic reduction of US virgin forest area from 1620 to present to explain the world.
5points

#60 What Time Do Europeans Typically Wake Up?

Color-coded map showing average morning wake-up times across European countries to explain the world.
5points
37
1