



Bored Panda
99 Fascinating Maps That Explain The World Better Than Any Spreadsheet (New Pics)

99 Fascinating Maps That Explain The World Better Than Any Spreadsheet (New Pics)

37
1
Numbers and geography. Neither, as my family never tires of pointing out, is exactly my strong suit. A spreadsheet? My eyes glaze over instantly. Need directions? You’re better off staying home than listening to me. Maps, however, are a bit of a different story. Maybe it’s because a good map does the hard work for you. Take a pile of data that would normally send me running, add a few colors, and suddenly order is restored to the world (or at least the part of it on the map). And it’s not all navigation, either.
Turns out some maps even reveal all sorts of curiosities you never knew you wanted to know about, like which European countries use a comma instead of a decimal point, where it’s illegal to boil a lobster alive, or how many hours you’d have to work to buy GTA VI, depending on where you live. So whether you’re a geography buff or someone who, like me, still gets lost on the way to the shops, here are some of the most fascinating maps out there, plus some expert insight from Philippa Irvine, a geography lecturer at Rhodes University in South Africa.

#21 Countries By How Many Women Attend University Education Compared To Men
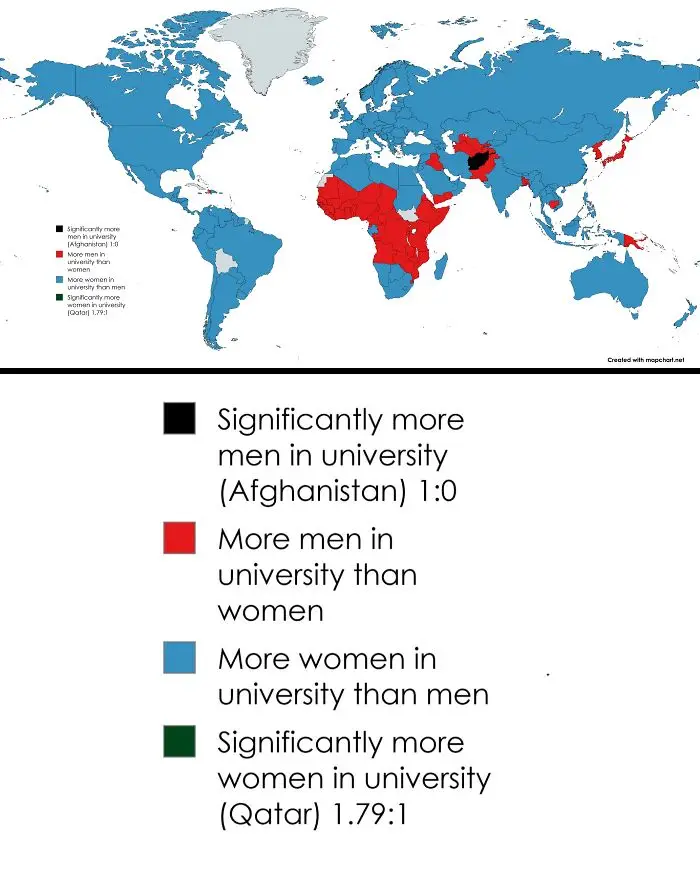
Educational world map showing gender ratio in universities worldwide.
7points

That combination is part of what makes maps so powerful. “Maps reveal spatial relationships, whether it’s distance, areal coverage, density or clustering,” Irvine explains. But they can also show “what is important to planners, communities and cultures,” from how a city is laid out to how its land is used.
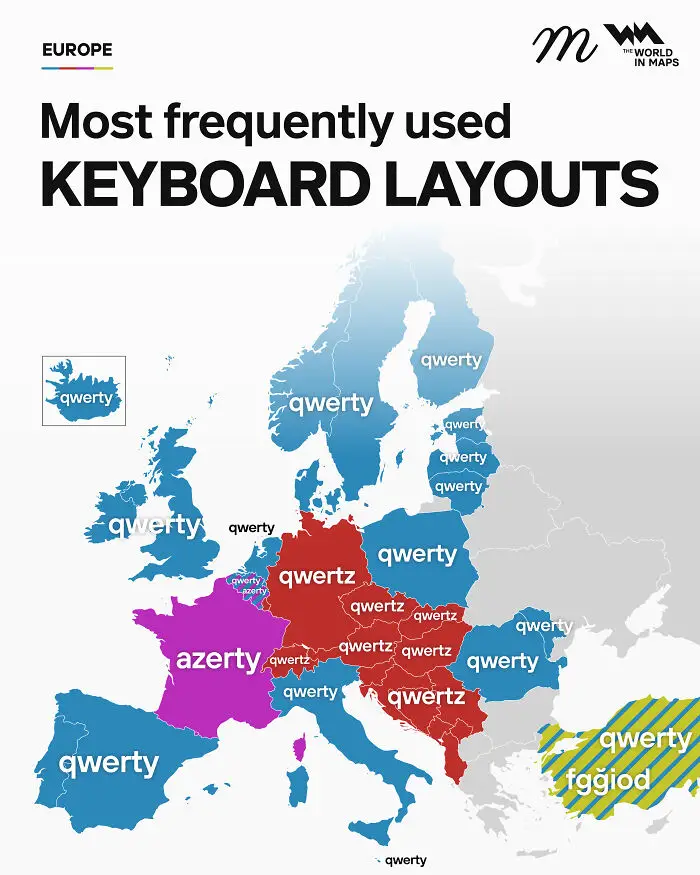
#22 Most Frequently Used Keyboard Layouts In Europe

Fascinating maps of Europe highlighting the most frequently used keyboard layouts by country.
7points

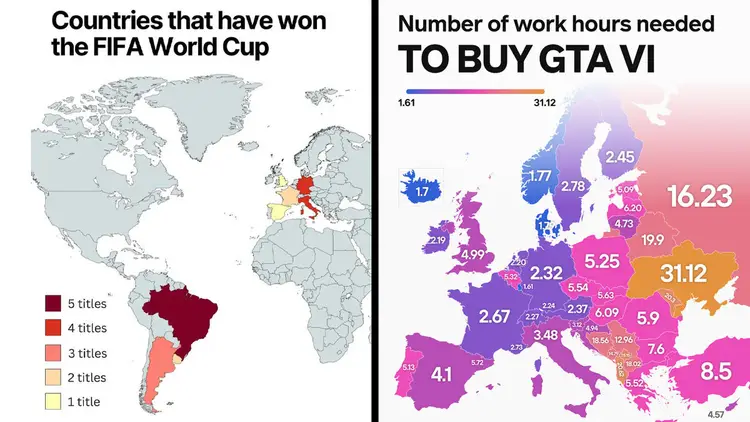
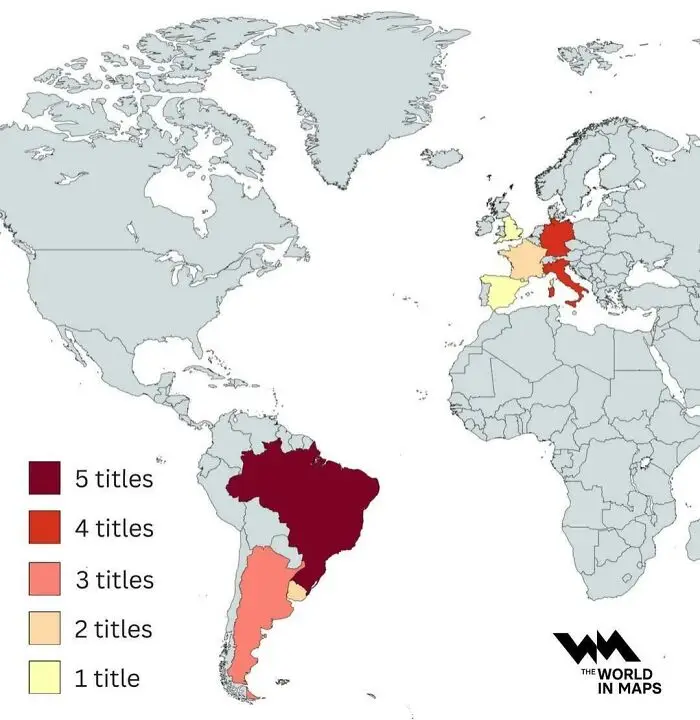
#23 Countries That Have Won The FIFA World Cup

A world map showing global sports titles won by country to explain the world.
7points

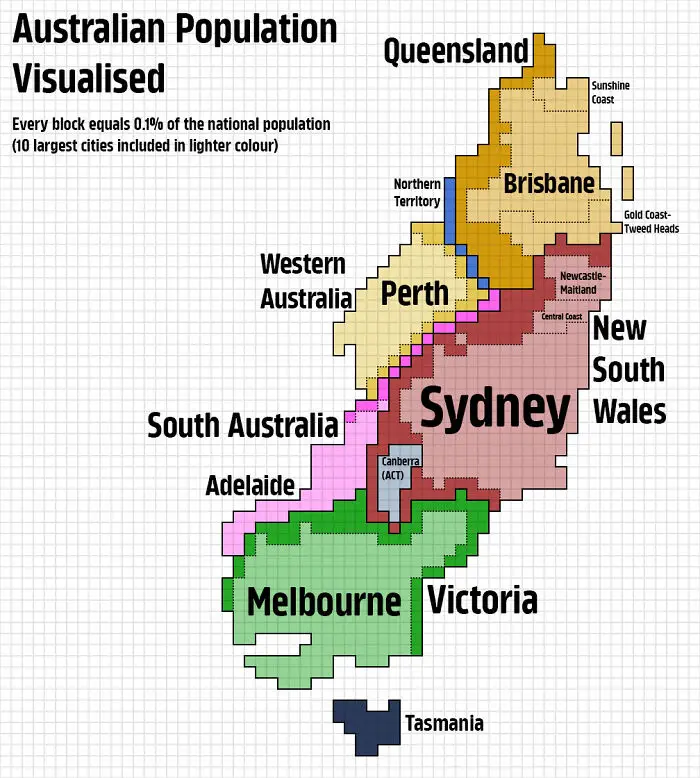
#24 Australian Population Visualised

A pixelated map displaying Australian population density across regions and major cities.
7points

And that’s the thing about maps: they’re never just a neutral picture of the world. Every one involves choices—and that’s where things get a little tricky. As geographer Mark Monmonier famously wrote, “Not only is it easy to lie with maps, it’s essential.” Squeezing a round, three-dimensional world onto a flat page or screen means something has to give. So, he argues, even an accurate map has to tell a few “white lies” to be useful.
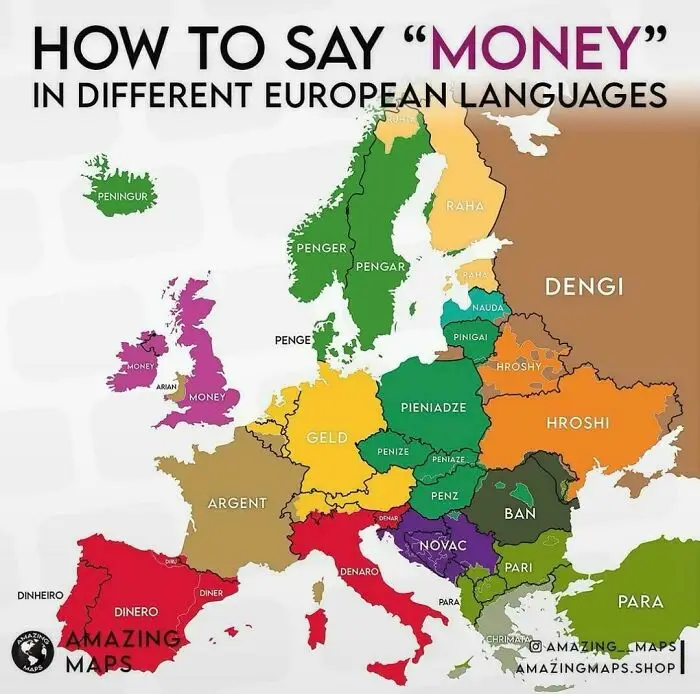
#25 How To Say Money In Different European Languages

A color-coded linguistic map showing how to say money across different European countries.
7points

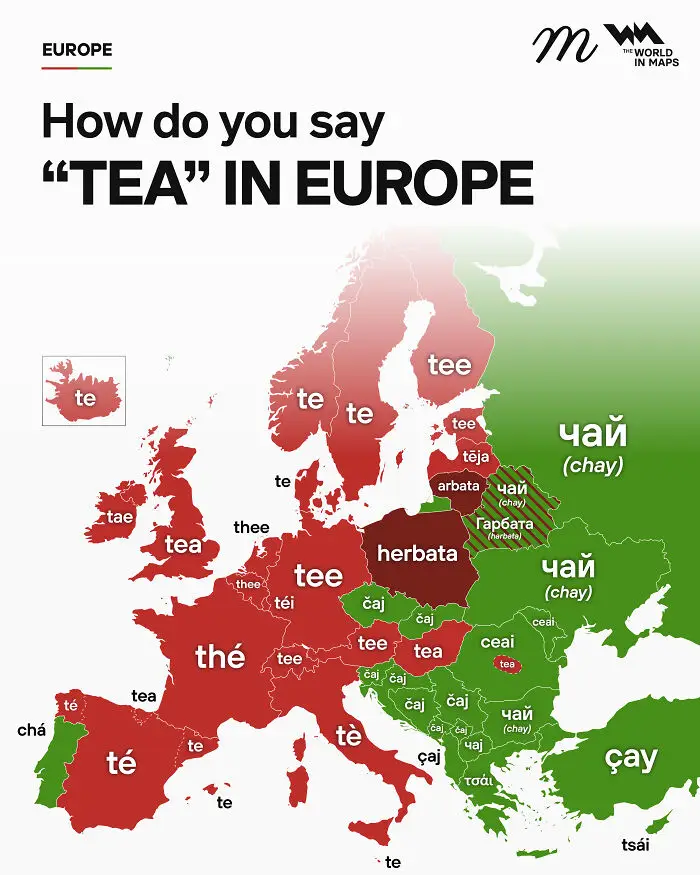
#26 How Do You Say "Tea" In Europe

An informative map showing how to say the word tea in various European languages.
7points

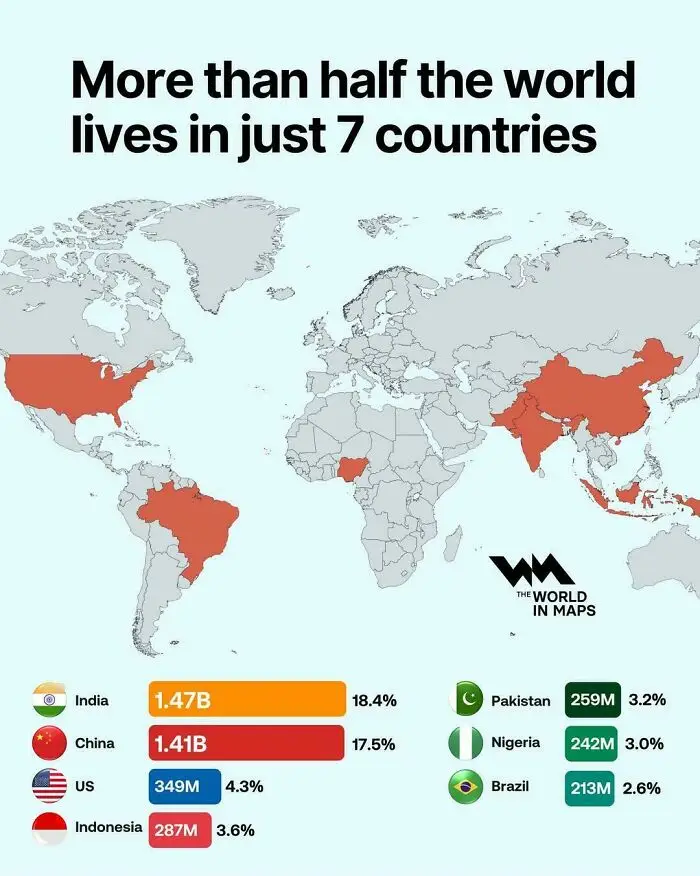
#27 More Than Half Of The World Lives In Just 7 Countries

Global population map highlighting seven most populous countries, example of fascinating maps.
7points

Irvine points to projections, “the geometry of it all,” as something that’s often unseen. The widely used Mercator projection, for example, stretches land the closer it gets to the poles. As Rob Lammle writes for Mental Floss, that’s why Greenland looks about the same size as Africa, when Africa is actually around 14 times bigger. And it isn’t only the shape of the world that gets skewed. “Bias is inherent within maps,” Irvine says. “You always need to ask what is shown, what is not shown, and how it is shown.”
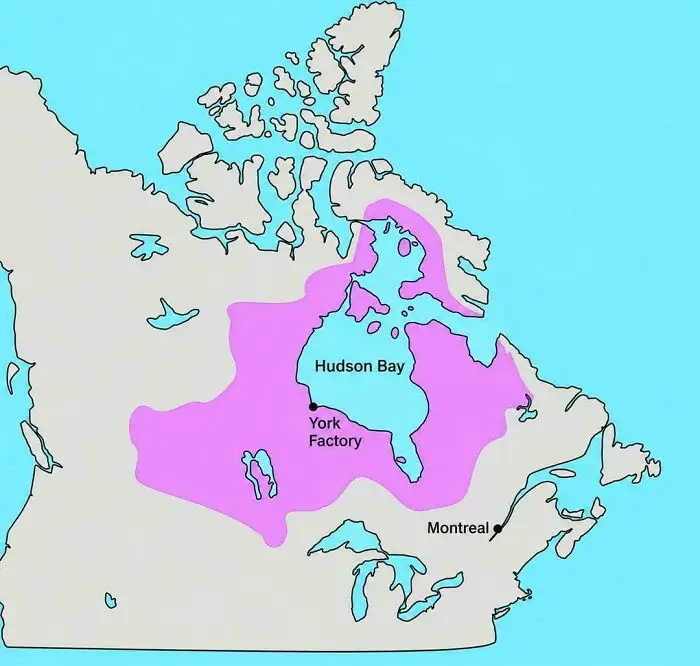
#28 A Private Company Once Controlled This Much Of North America

Historical map of North America outlining Hudson Bay territories as one of the fascinating maps.
7points

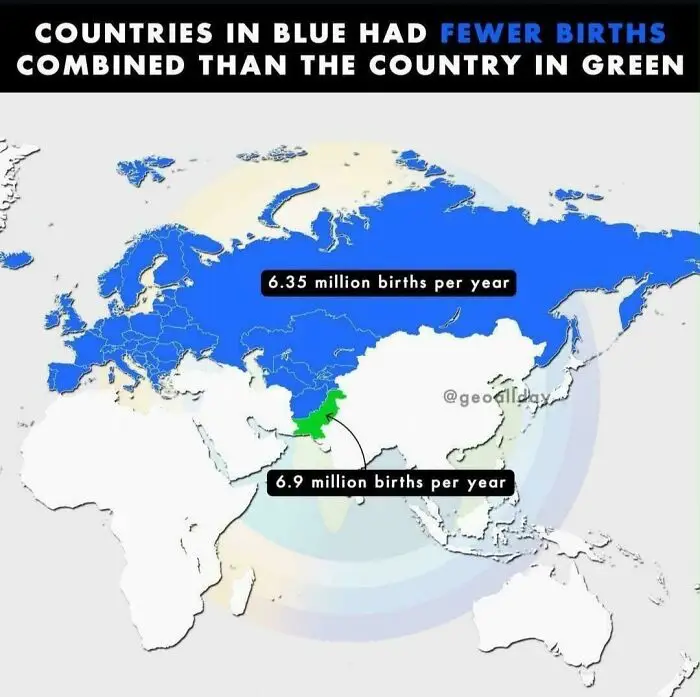
#29 Birth Rates In Pakistan Are Crazy

World map showing annual birth rates by country, featured among fascinating maps.
7points

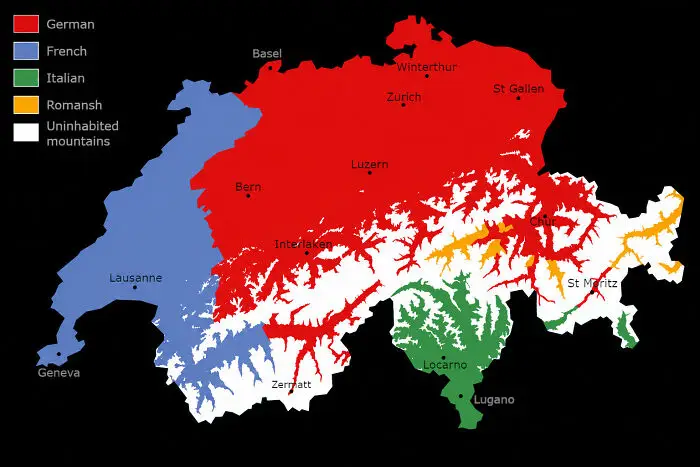
#30 Language Map Of Switzerland, Excluding Uninhabited Mountains

Linguistic map of Switzerland displaying language regions, one of many fascinating maps.
7points

Maps can also be deeply personal. Just think of Mason’s childhood maps—frogs and praying mantises and all. For Irvine, these are the most interesting kind. “The most exciting or interesting maps are the personal ones,” she says, “the ones that show a person’s psychogeography (the character and meanings that they attach to spaces) or their mental maps.”

So as you scroll through the maps below, enjoy the oddities, take a moment to notice what each one chooses to show, and maybe think about what your own map of the world would look like.

#31 Lithuania At It's Historical Peak (15th Century) Also Known As Grand Duchy Of Lithuania, It Expanded Up To 900,000-100,000 Sq Km
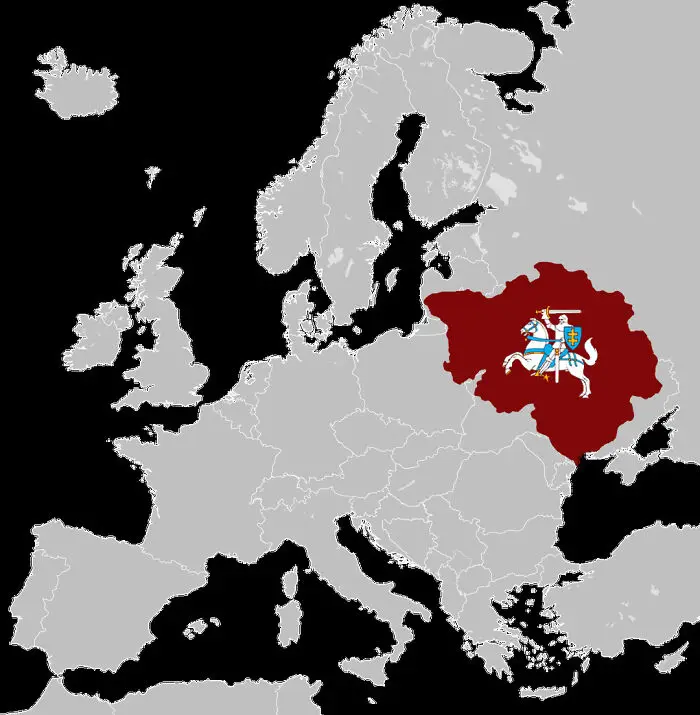
Fascinating maps that explain the world showing historical map highlighting Grand Duchy of Lithuania in Europe.
Report
7points

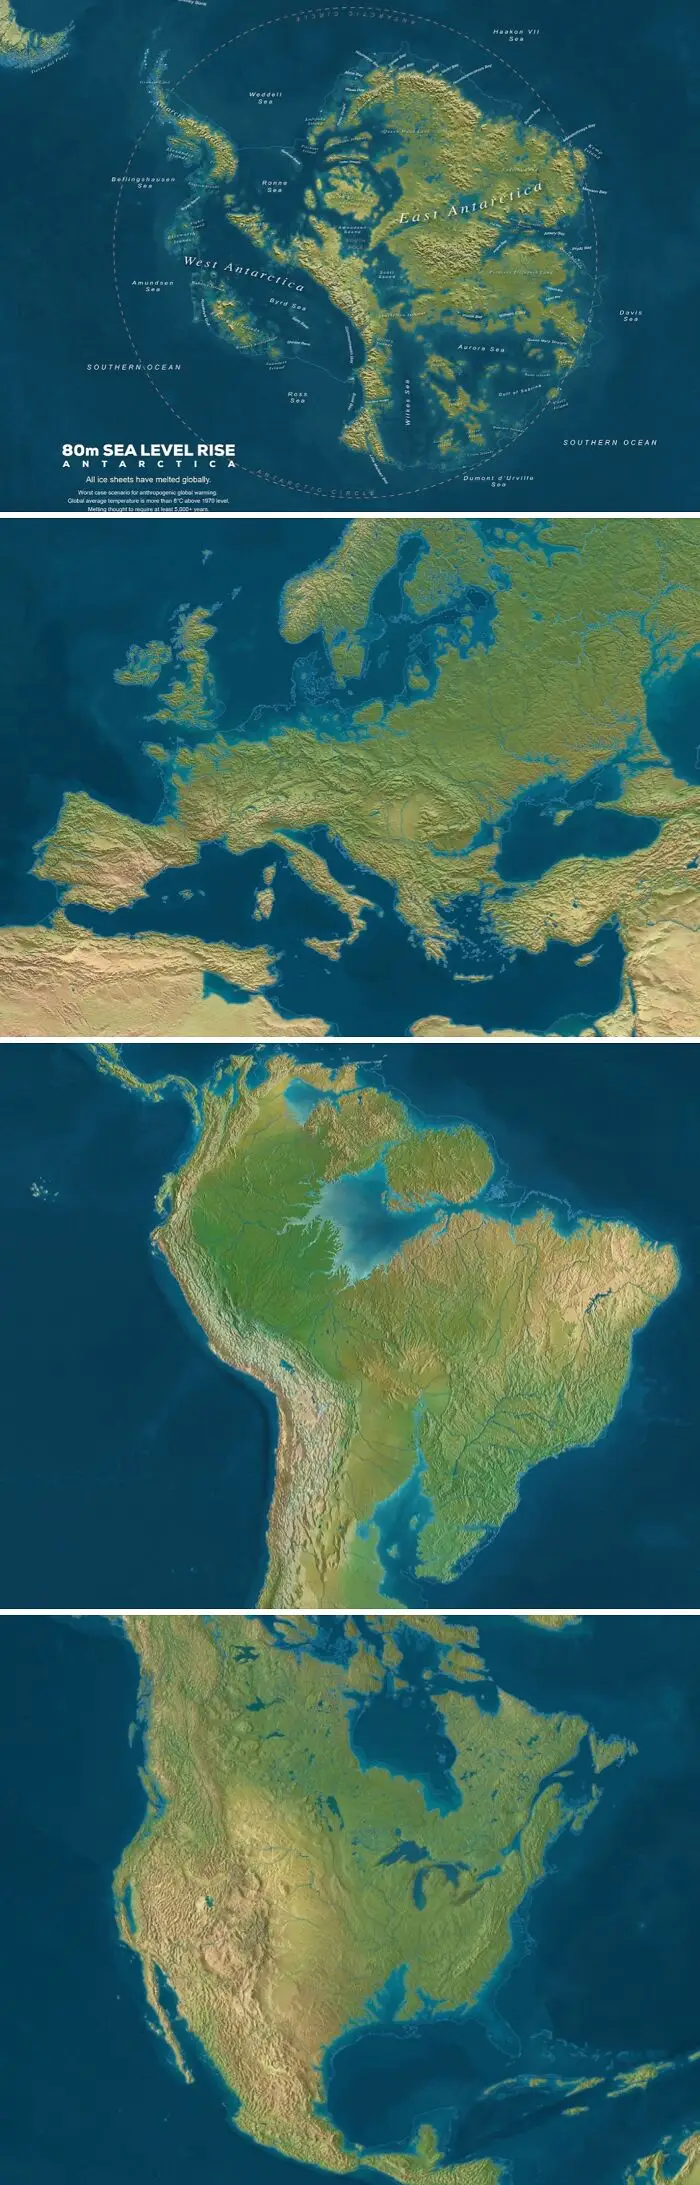
#32 Sea Level If All Ice Would Melt

Fascinating maps that explain the world showing global coastlines with an 80m sea level rise scenario.
7points

#33 The Shortest (Fastest) Road Trip Visiting All EU Countries, Find The Errors
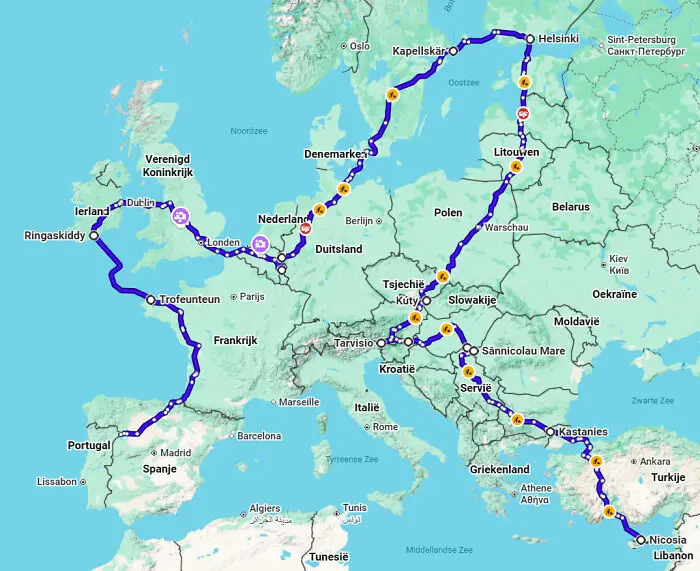
A map of Europe displaying an extensive driving route across multiple countries.
7points

#34 Spilhaus Projection Is One Of The Most Interesting Ones To Map The World's Oceans
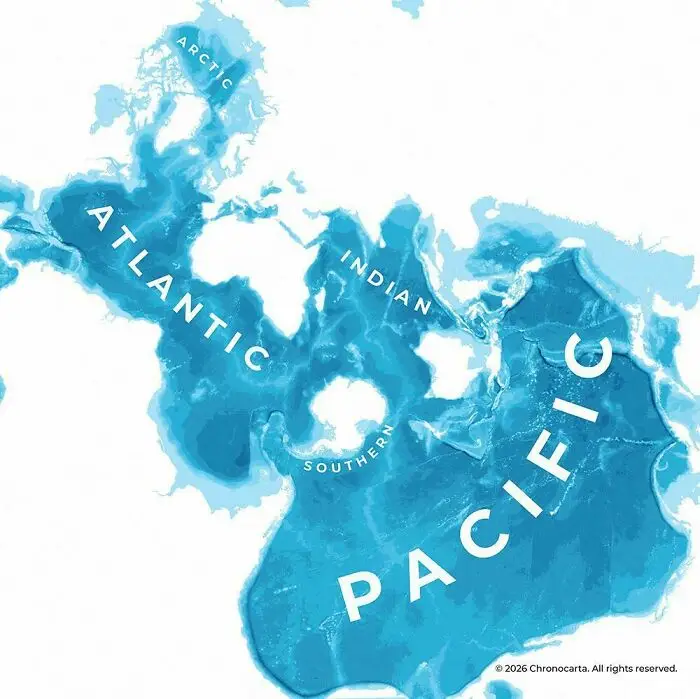
A unique map that explains the world oceans centered around the South Pole.
7points

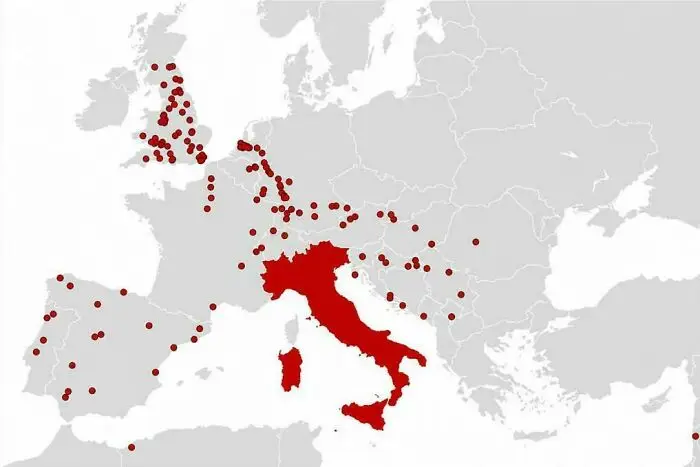
#35 Cities The Romans Founded Outside Italy

A map of Europe displaying locations with red markers centered around Italy
7points

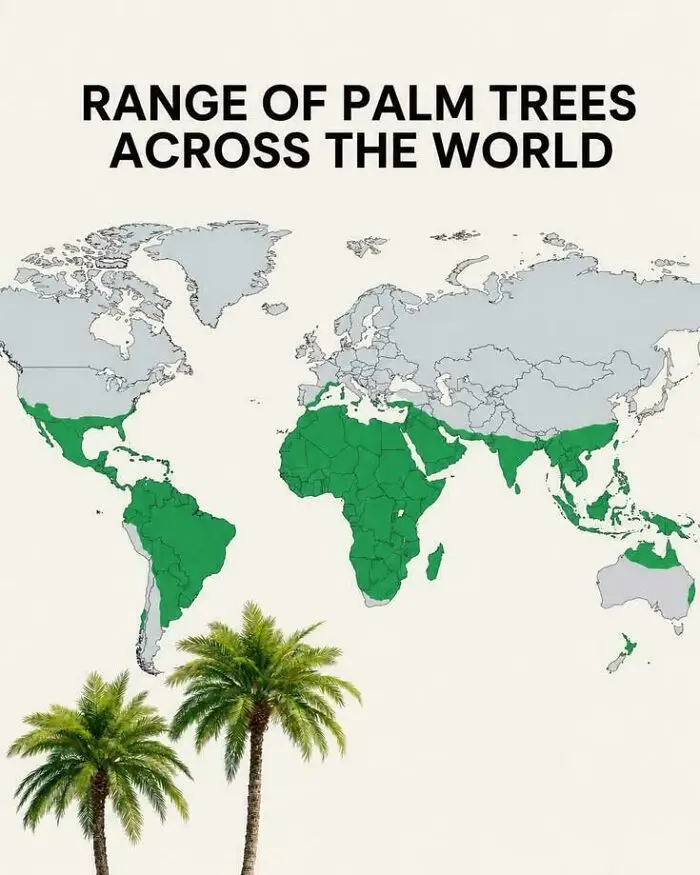
#36 Range Of Palm Trees Across The World

A world map highlighting the geographic distribution range of palm trees across tropical and subtropical regions.
Report
7points

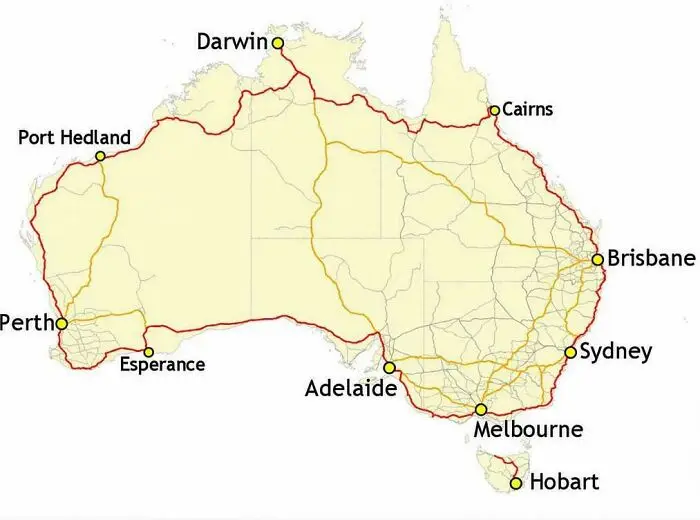
#37 Australia's Highway 1 Is The World's Longest National Highway

A map of Australia highlighting major coastal highway routes connecting cities as part of fascinating maps that explain.
7points

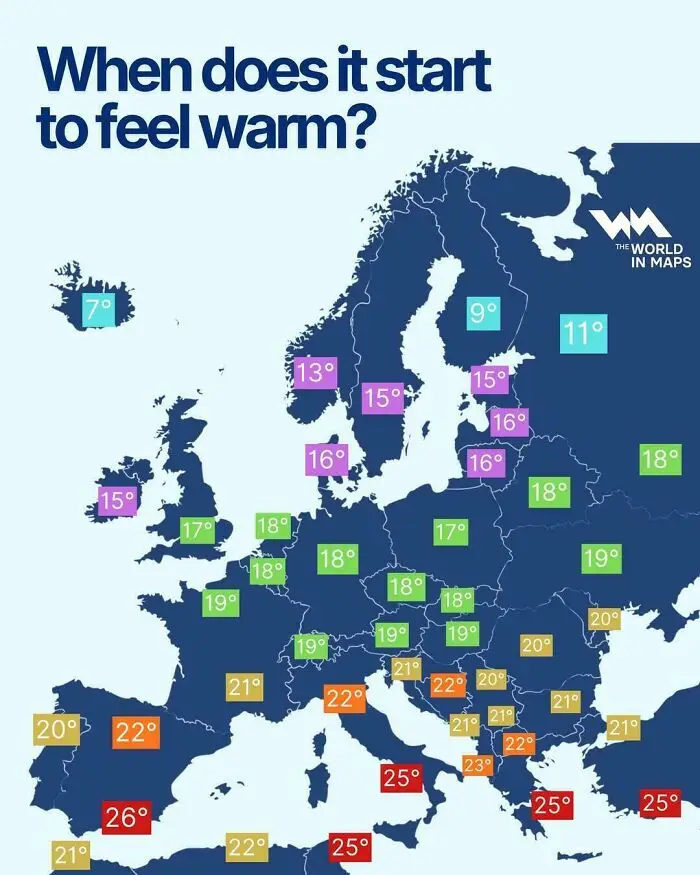
#38 When Does It Start To Feel Warm?

Fascinating maps of Europe displaying regional temperatures at which people consider it warm.
6points

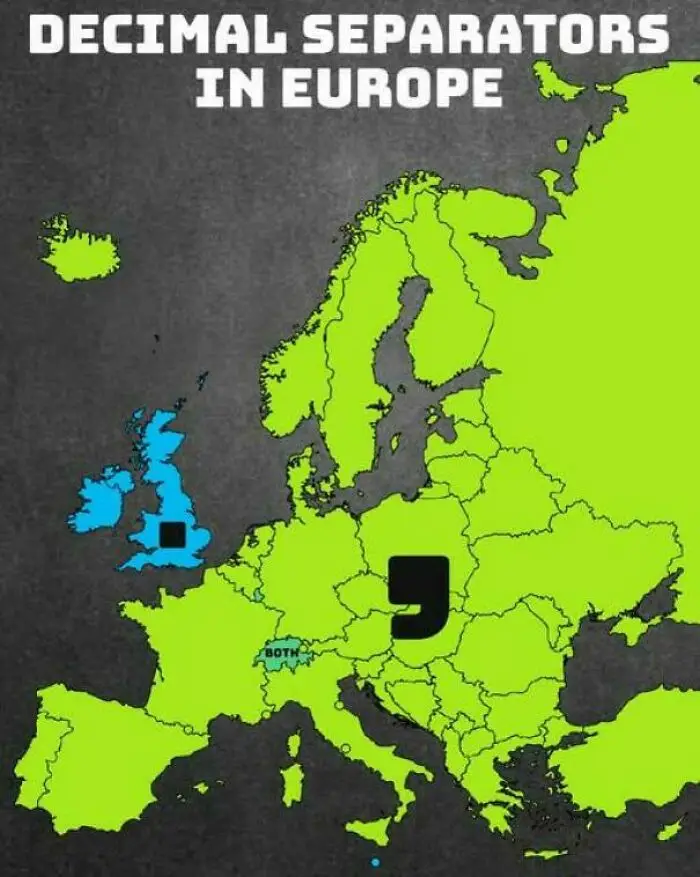
#39 Decimal Separators Used In Europe

A color-coded map showing the distribution of decimal separators used across European countries.
6points

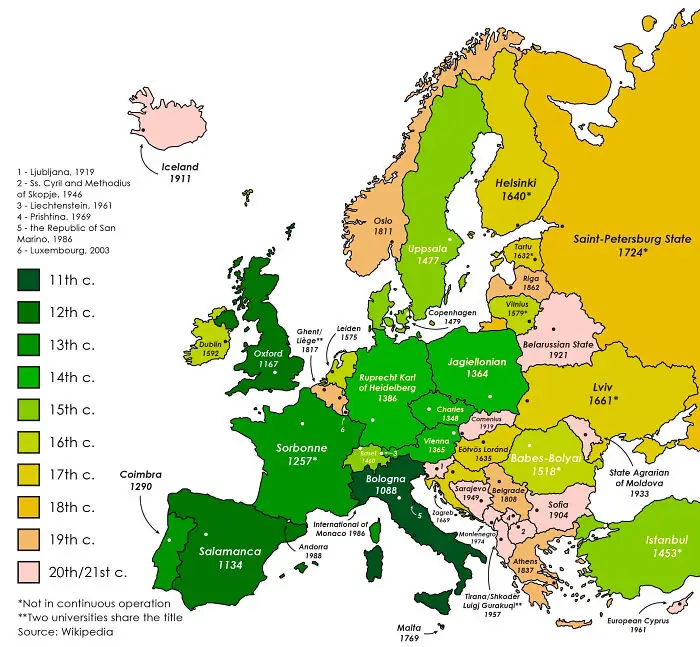
#40 The Oldest Continuously Operating Universities In Each European Country

A fascinating map of Europe color-coded by the century in which each country established its oldest university.
Report
6points
37
1