


Bored Panda
38 Cool Charts And Guides That Might Change Your Perspective On The World (New Pics)
CuriositiesMAY 2, 2025

38 Cool Charts And Guides That Might Change Your Perspective On The World (New Pics)

62
20
Numbers and facts can be difficult to comprehend when they're merely symbols on the screen. However, data becomes much more evident once it is visualized.
The subreddit r/CooolGuides is an excellent example of this axiom. Its 5.9 million members share charts, diagrams, maps, and other thought-provoking pictures on sports, travel, history, and virtually every subject you can imagine.
We at Bored Panda love them and have already covered the online community numerous times, but they've made so many interesting posts since the last one that we just had to put together a new collection of our recent favorites.
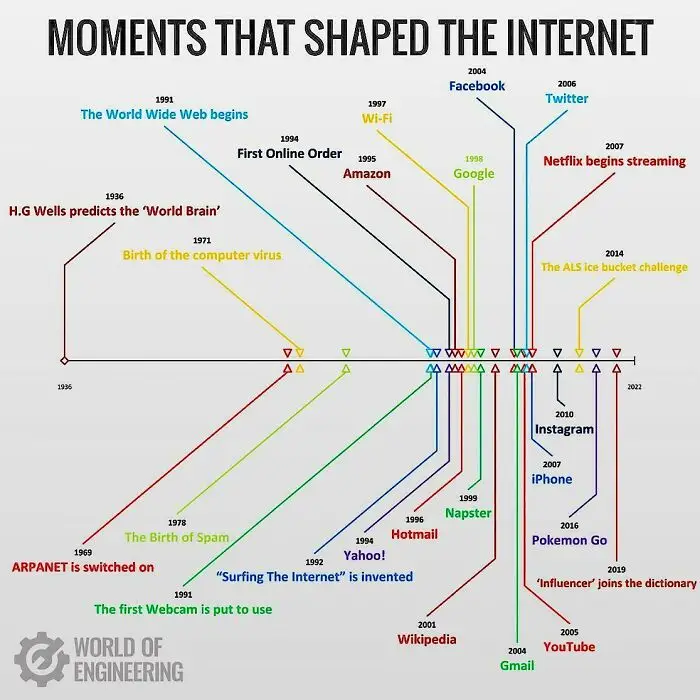
#21 Iconic Internet Milestones

Timeline chart showing unique moments that shaped the internet with key events and milestones in internet history.
Report
23points

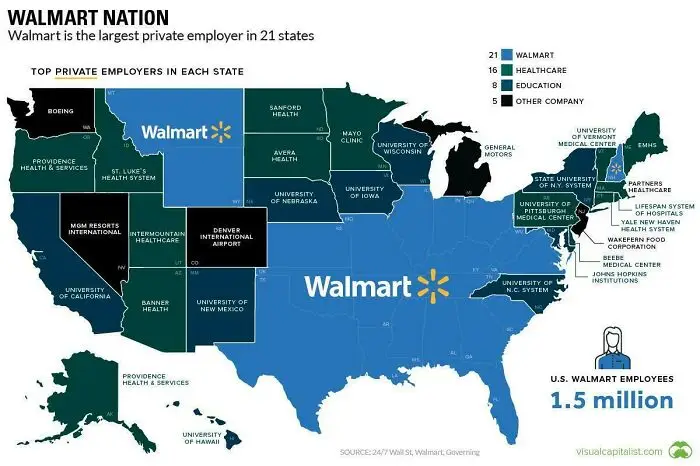
#22 Walmart’s Coast-to-Coast Grip

Map showing Walmart as top private employer in 21 states, highlighting key employers in healthcare, education, and other sectors.
22points

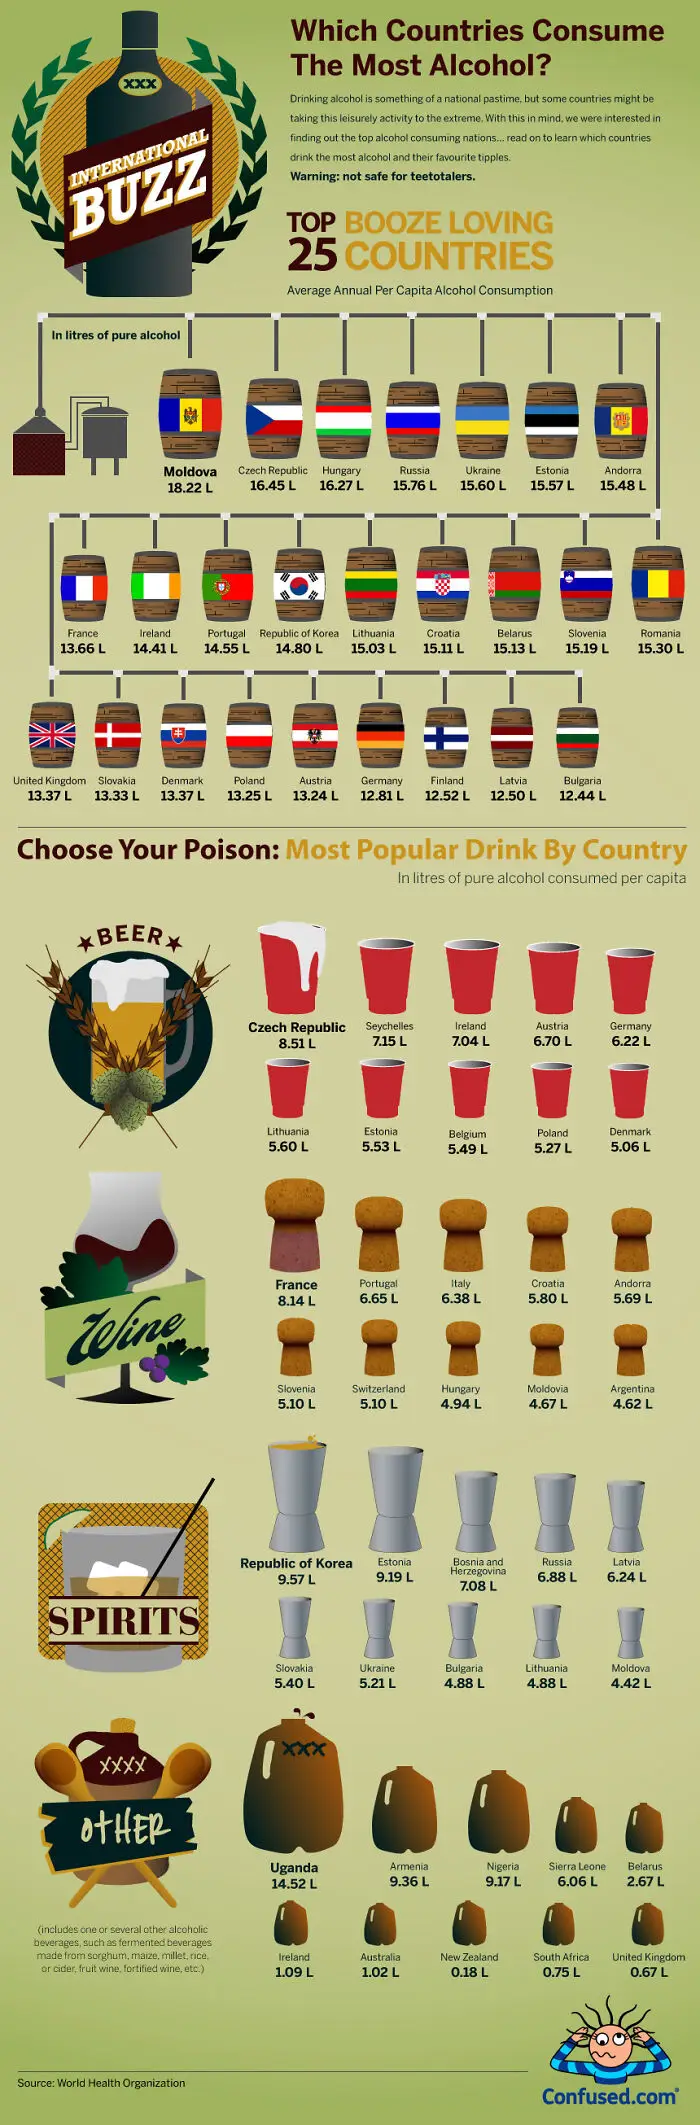
#23 Top Booze Hotspots Revealed

Infographic showing top alcohol consuming countries, average annual per capita alcohol consumption, and popular drinks by country in unique charts.
20points

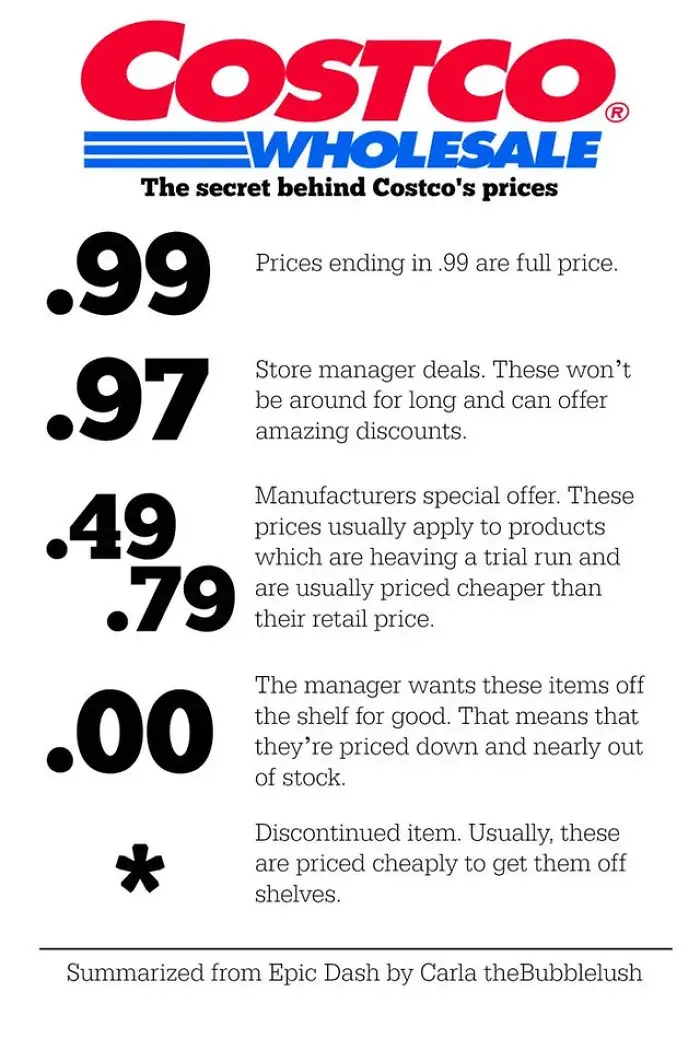
#24 Decoding Price Codes

Costco price secrets chart explaining meanings of .99, .97, .49, .79, .00, and * price endings for discounts and deals.
20points

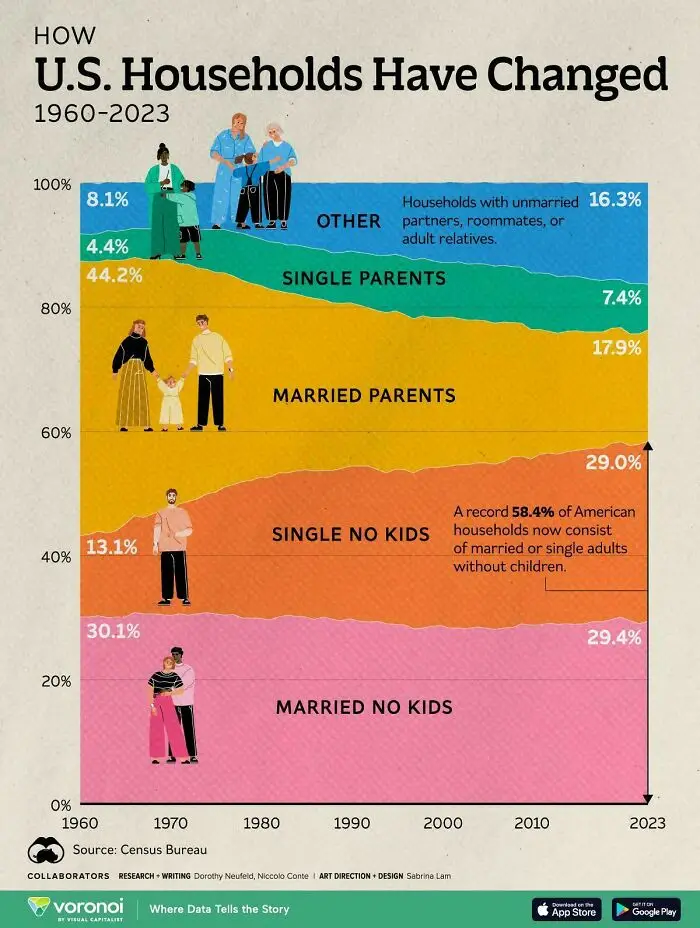
#25 Living Arrangements Evolved

Chart showing how U.S. households have changed from 1960 to 2023 with various family types by percentage.
20points

#26 Finger Tricks 101

Hand-drawn unique visual guide showing steps of placing fingers in a container with objects and water for observation.
20points

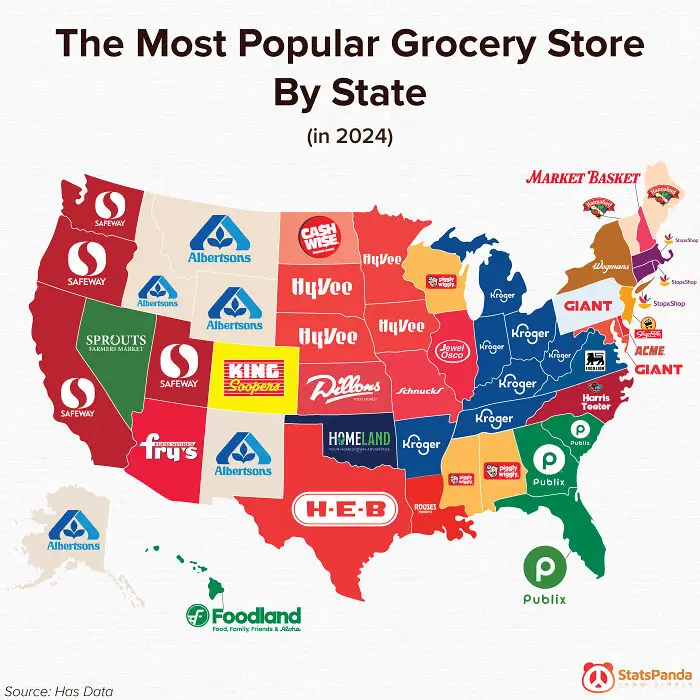
#27 Grocery Wars Uncovered

Map showing the most popular grocery store by state in 2024 as part of unique charts and guides visuals.
17points

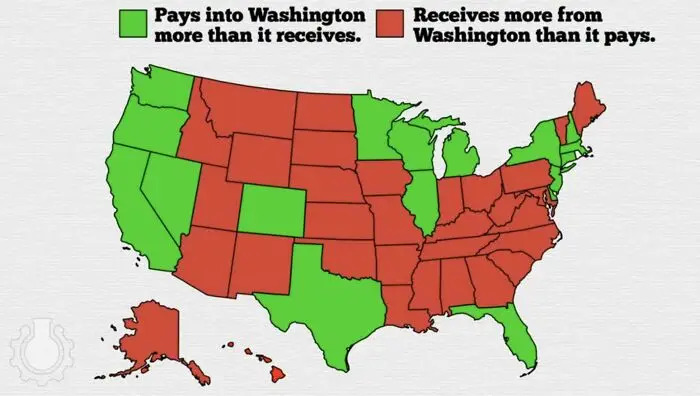
#28 Who’s Winning the Money Game?

US map chart showing states paying more into Washington versus states receiving more from Washington in federal funds.
17points

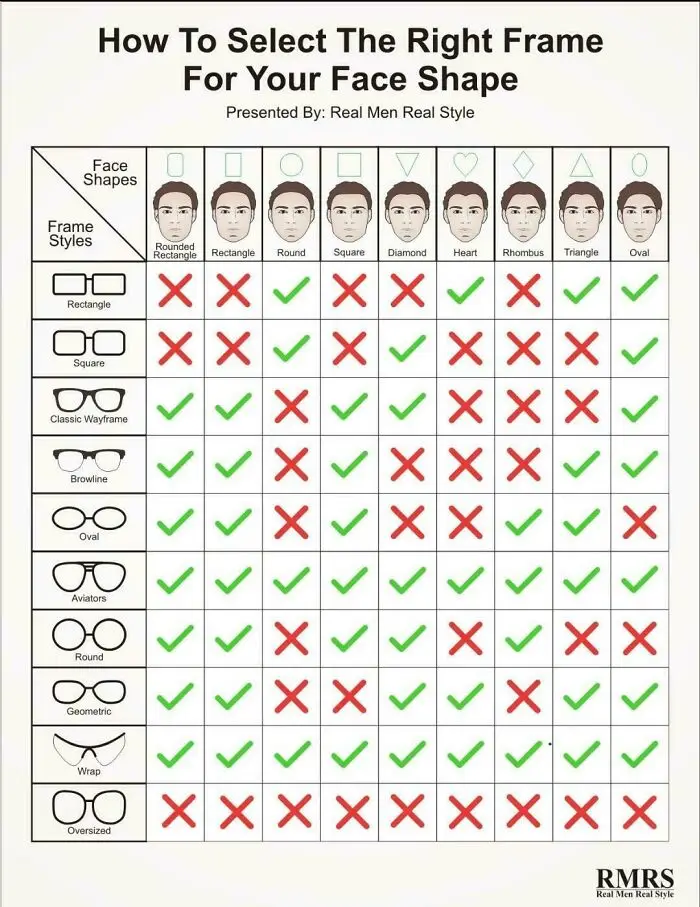
#29 Frames That Fit Faces

Chart showing how to select the right eyeglass frames for different face shapes with green checks and red crosses.
16points

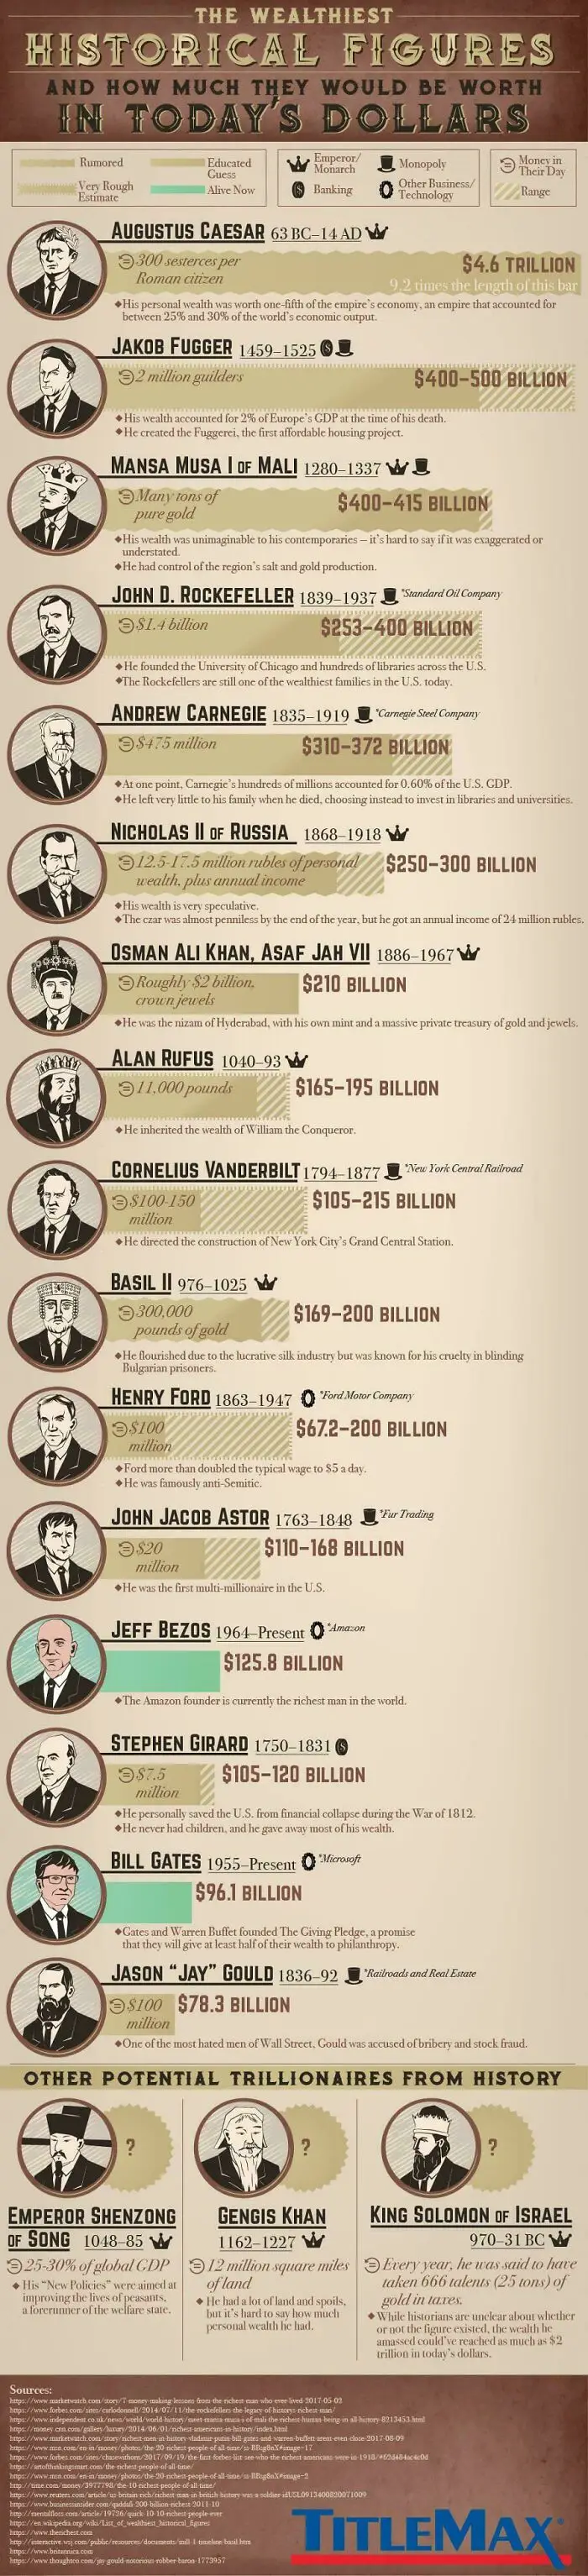
#30 History’s Heaviest Wallets

Infographic showing wealth estimates of historical figures converted to today's dollars with visual bars and portraits.
Report
16points

#31 Underneath the Grit

Underbody image of a vehicle showing detailed labeled charts and guides of mechanical parts and components.
Report
16points

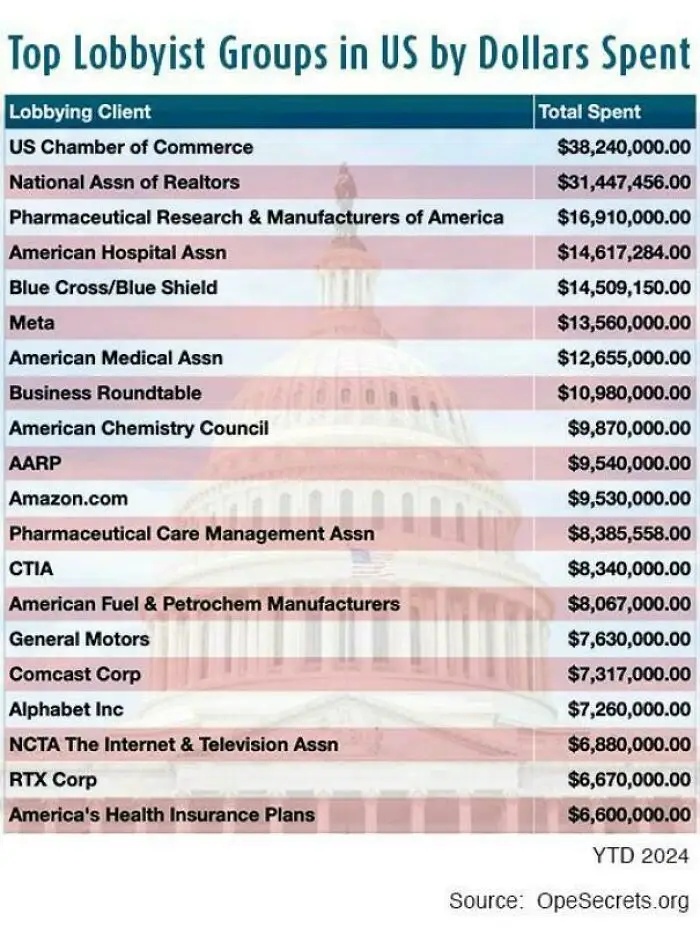
#32 Cash Talks Louder

Chart showing top US lobbyist groups by dollars spent in 2024 with organizations like US Chamber of Commerce and Meta.
14points

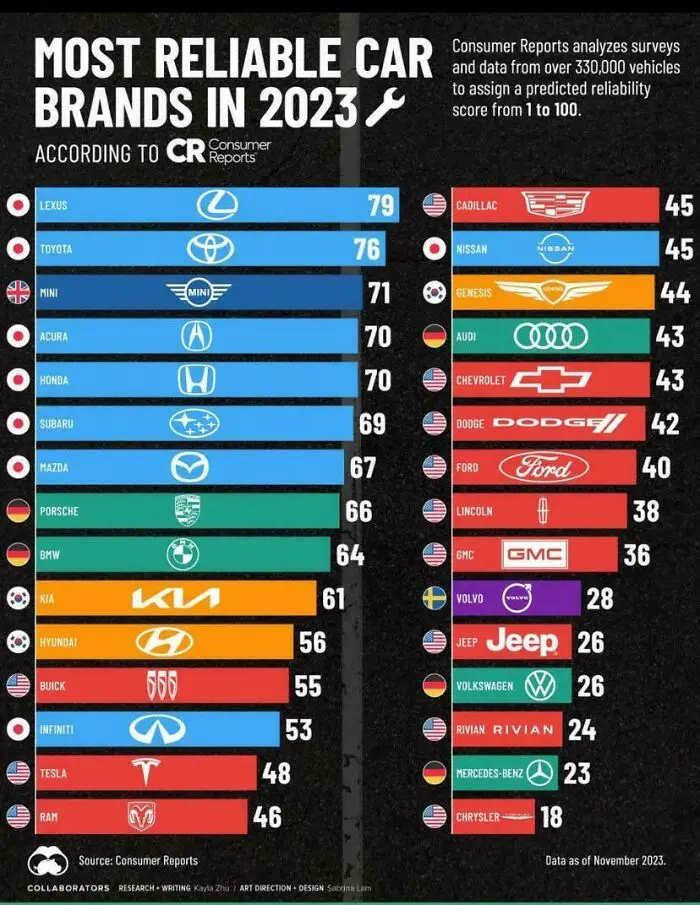
#33 Ranking The Ride Quality

Chart showing most reliable car brands in 2023 with reliability scores based on Consumer Reports data.
13points

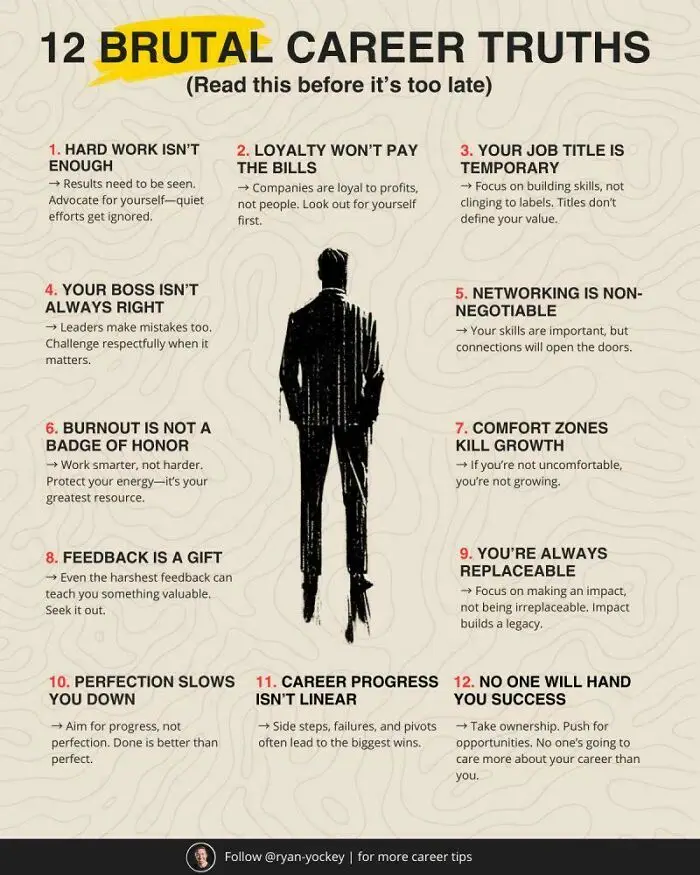
#34 Work Smarter, Not Harder

Infographic showing 12 brutal career truths with key advice on work, growth, feedback, and success in career development.
Report
12points

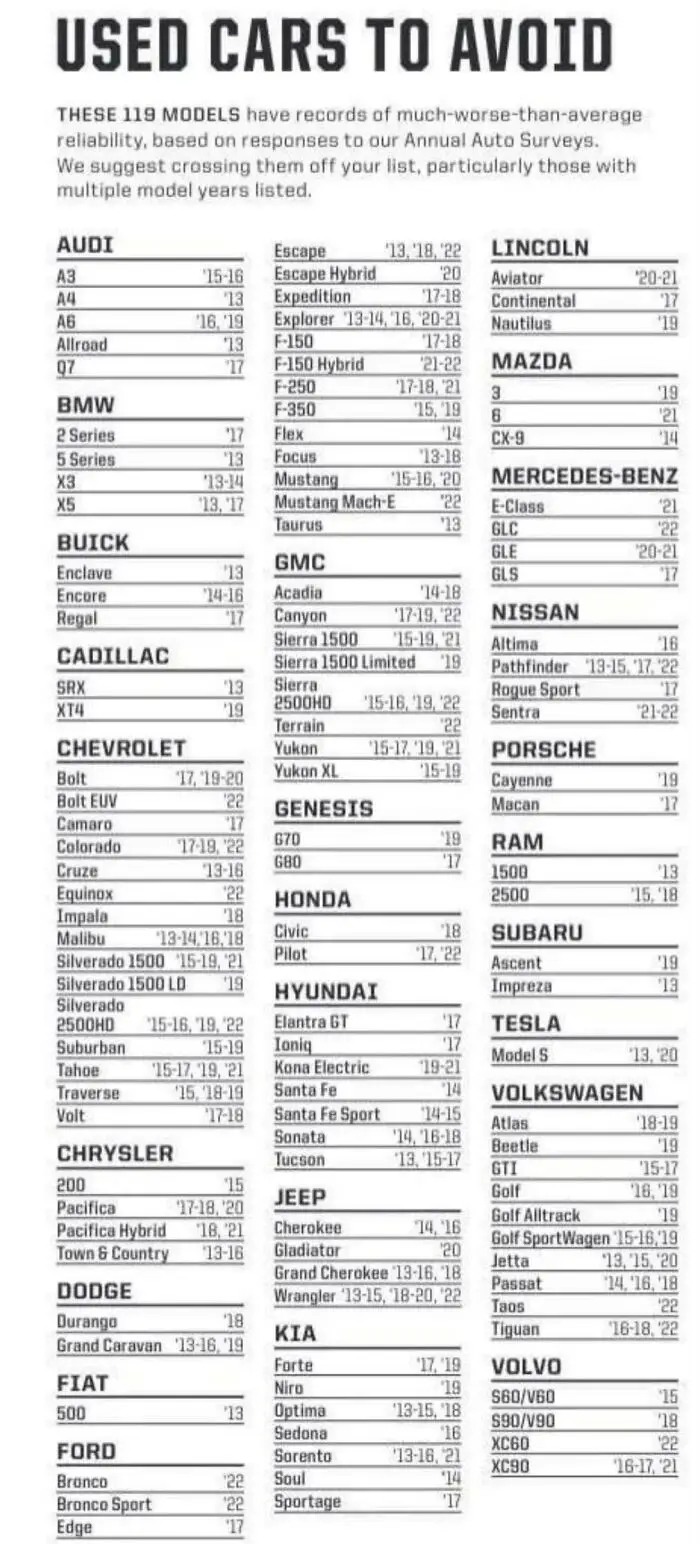
#35 Reliability Red Flags

Chart listing used cars to avoid based on reliability reports from annual auto surveys across various brands and models.
12points

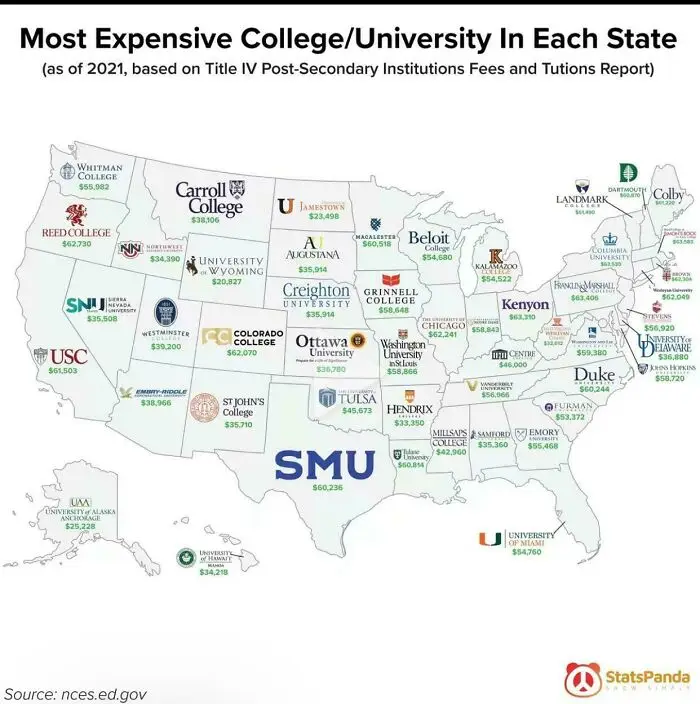
#36 Pricey Pursuits Across America

Map of most expensive colleges and universities in each US state with tuition fees, showcasing unique charts and visual guides.
6points

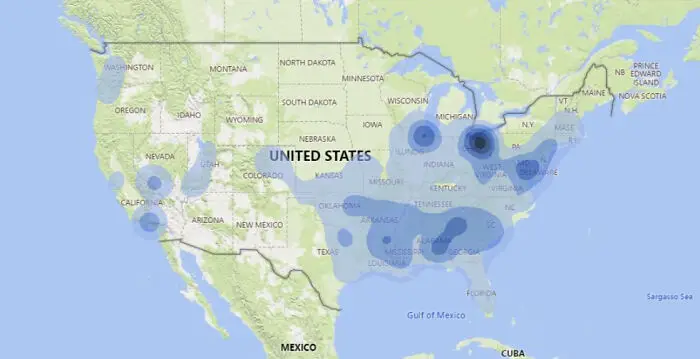
#37 Hidden Hotspots Revealed

Heatmap chart showing concentration of data points across various regions in the United States, a unique visual guide.
Report
5points

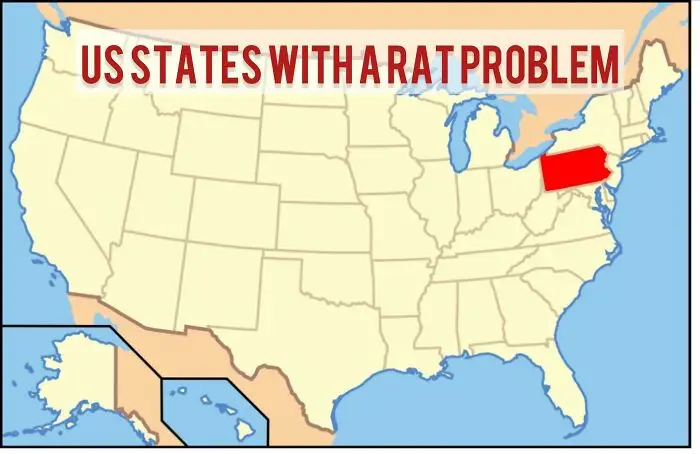
#38 Only One’s Got Issues

Map highlighting US states with a rat problem, focusing on visual data from unique charts and guides.
Report
3points
62
20