



Bored Panda
38 Cool Charts And Guides That Might Change Your Perspective On The World (New Pics)
CuriositiesMAY 2, 2025

38 Cool Charts And Guides That Might Change Your Perspective On The World (New Pics)

62
20
Numbers and facts can be difficult to comprehend when they're merely symbols on the screen. However, data becomes much more evident once it is visualized.
The subreddit r/CooolGuides is an excellent example of this axiom. Its 5.9 million members share charts, diagrams, maps, and other thought-provoking pictures on sports, travel, history, and virtually every subject you can imagine.
We at Bored Panda love them and have already covered the online community numerous times, but they've made so many interesting posts since the last one that we just had to put together a new collection of our recent favorites.

#1 Unlikely Neighborhood Hero

Young opossum in grass with a guide explaining its role in pest control and nature cleanup benefits.
Report
146points

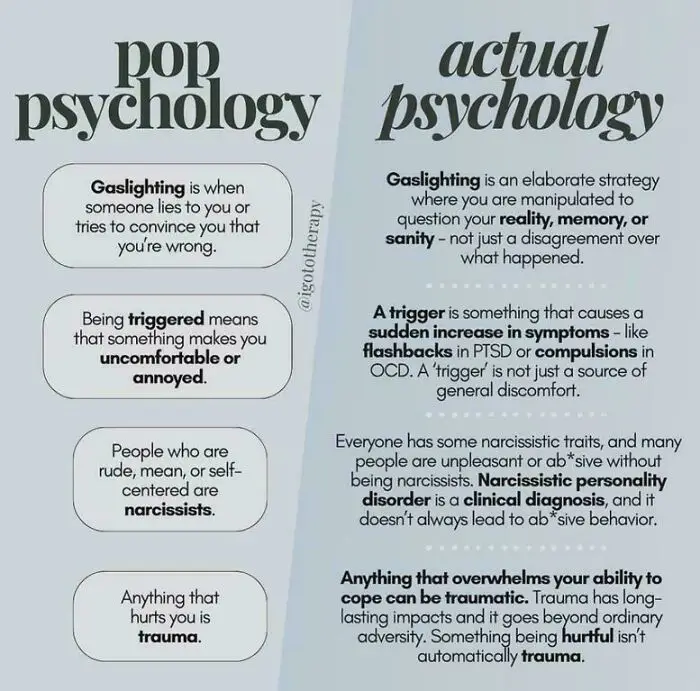
#2 Psychology Unpacked

Comparison chart contrasting pop psychology and actual psychology definitions of gaslighting, triggers, narcissism, and trauma.
142points

There's a study from 2023 that shows how effective visuals can be. Researchers Amjaad Mansour Alwadei and Mohammed Ali Mohsen conducted a 10-week experiment involving 41 Arab college students learning English.

The students were divided into two groups: one learned vocabulary through traditional methods, while the other used infographics tailored to their course material. These infographics transformed standard vocabulary lessons into engaging visual narratives, making complex words more accessible and memorable.

The results were striking: students who used infographics performed better in both recognizing and using new vocabulary, not just immediately after the lessons, but even weeks later. They also reported finding the visual approach more engaging and helpful compared to traditional methods.

#3 Secret Clubbing Signals

Tweet explaining a hand sign system used by a group of girls when clubbing to communicate in loud bars with unique visuals.
76points

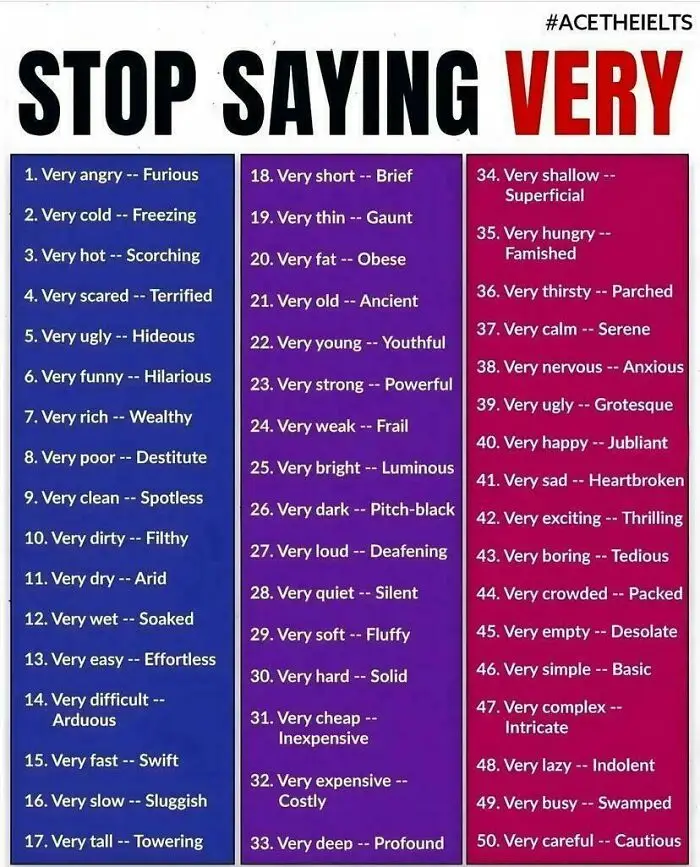
#4 Upgrade Your Adjectives

Chart listing 50 alternatives to using the word very with stronger descriptive adjectives for clearer communication.
73points

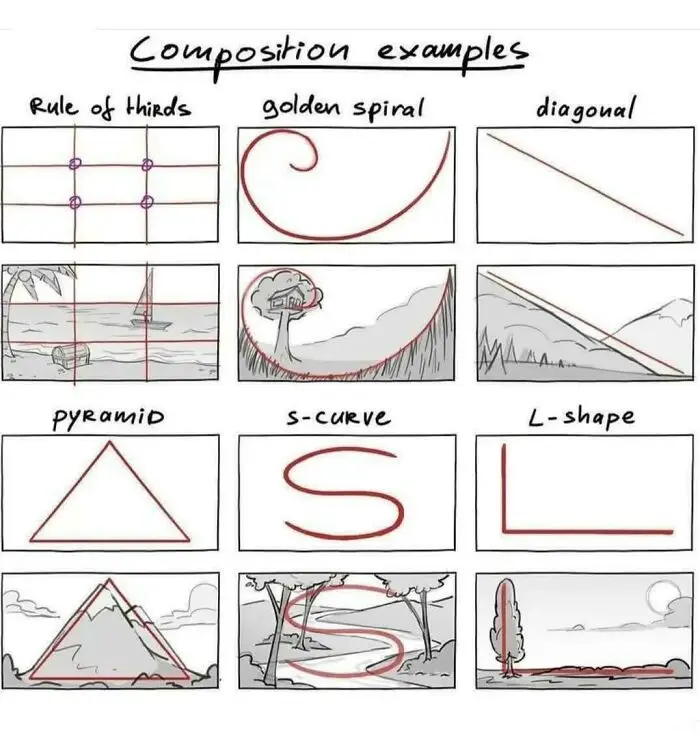
#5 Visual Playbook Basics

Diagram showing unique composition charts including rule of thirds, golden spiral, diagonal, pyramid, s-curve, and L-shape guides for visuals.
72points

Psychologist Haig Kouyoumdjian, Ph.D., says, "Words are abstract and rather difficult for the brain to retain, whereas visuals are concrete and, as such, more easily remembered."

To illustrate, he suggests a similar scenario to that in the aforementioned study, only with a more exciting twist. "Think about your past school days of having to learn a set of new vocabulary words each week. Now, think back to the first kiss you had or your high school prom date."

"Most probably, you had to put forth great effort to remember the vocabulary words. In contrast, when you were actually having your first kiss or your prom date, I bet you weren't trying to commit them to memory. Yet, you can quickly and effortlessly visualize these experiences (now, even years later). You can thank your brain’s amazing visual processor for your ability to easily remember life experiences. Your brain memorized these events for you automatically and without you even realizing what it was doing," the psychologist explains.
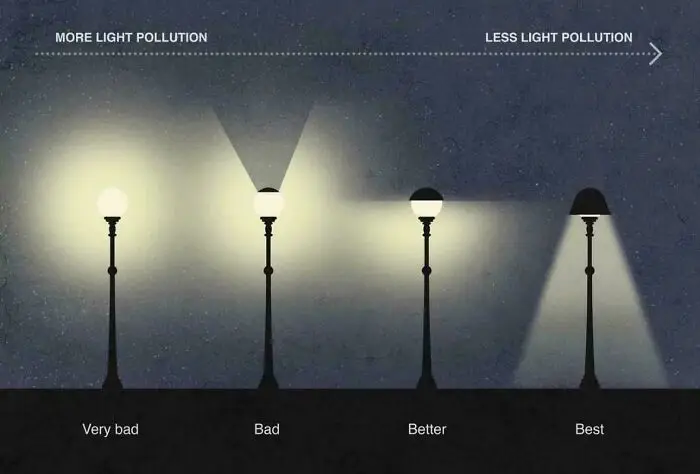
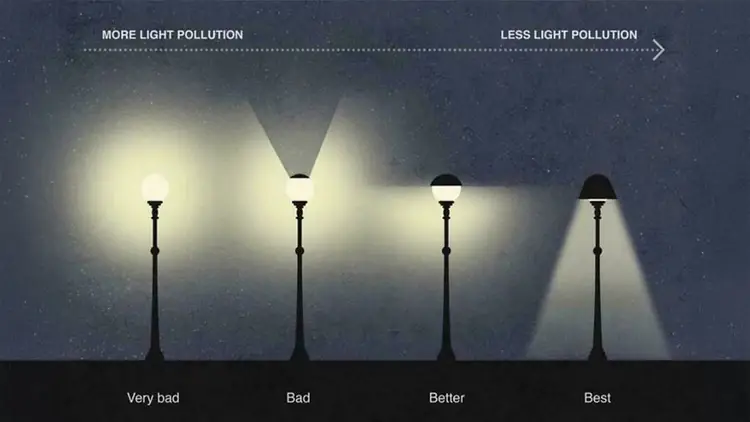
#6 Shedding Light on Pollution

Comparison chart showing streetlights with varying light pollution levels from very bad to best efficiency and brightness control.
66points

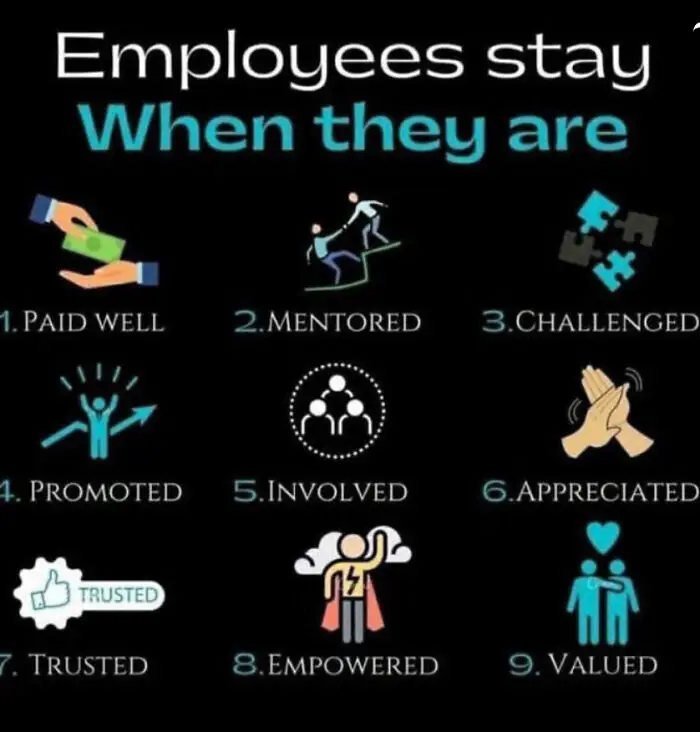
#7 What Really Keeps Them?

Infographic showing nine reasons employees stay, highlighting factors like being paid well, mentored, challenged, and empowered.
66points

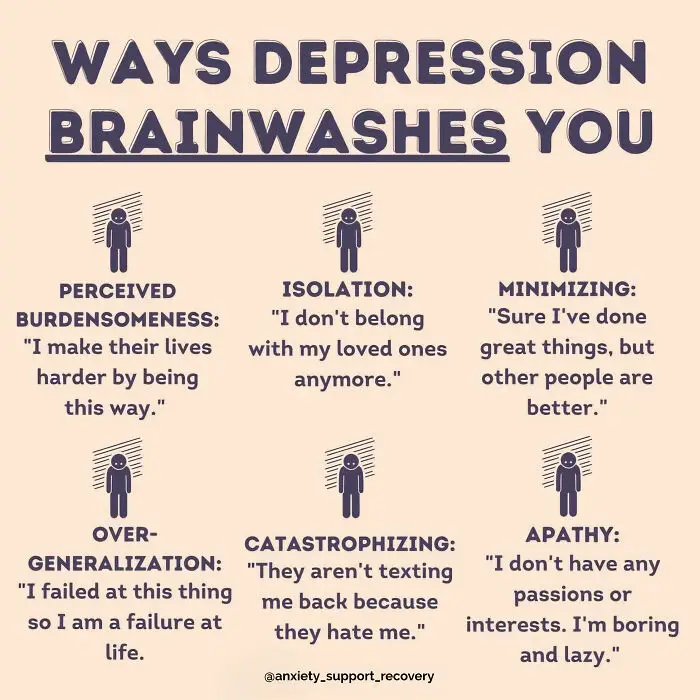
#8 Hidden Mind Tricks

Infographic showing unique charts explaining ways depression brainwashes you with examples of negative thoughts.
61points

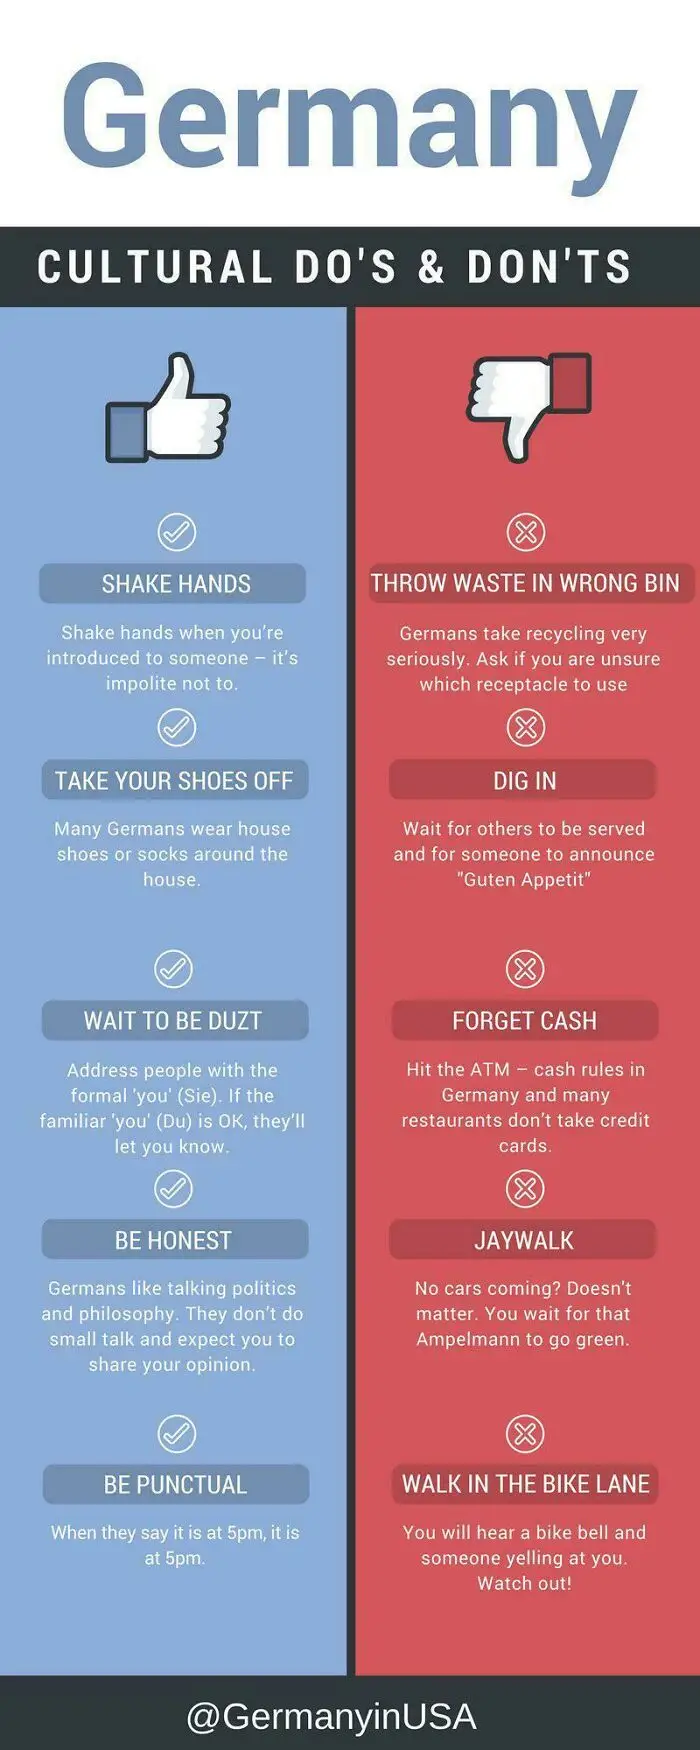
#9 The Do’s and Don\'ts Shuffle

Germany cultural do's and don'ts chart showing etiquette tips and common mistakes to avoid in social and public settings.
57points

According to Kouyoumdjian (and as we can see from this list), "Various types of visuals can be effective learning tools: photos, illustrations, icons, symbols, sketches, figures, and concept maps, to name only a few."

Just consider how memorable the visual graphics are in famous company logos! We instantly recognize the brand by seeing the visual graphic, even before reading the name.
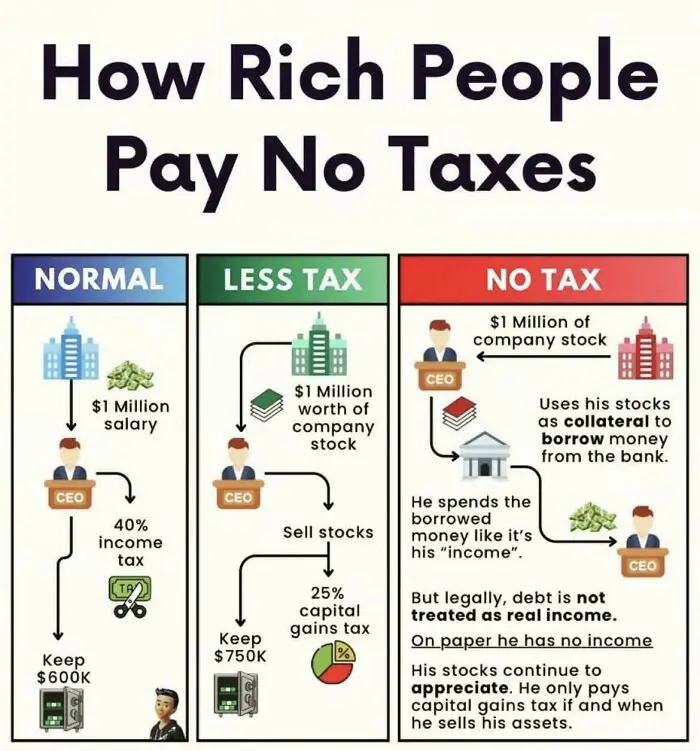
#10 Tax Tricks Uncovered

Infographic showing how rich people pay no taxes through salary, company stock, and borrowing strategies with tax implications.
54points

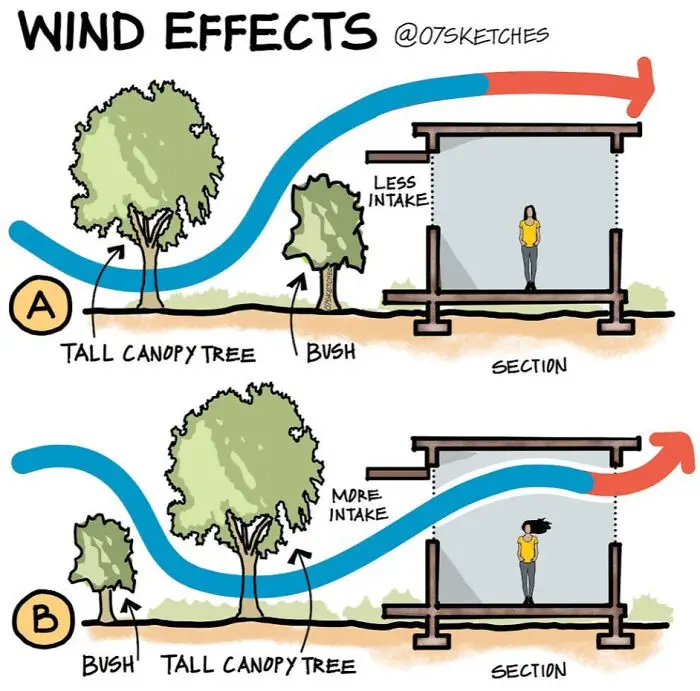
#11 Breezy Design 101

Illustration showing wind effects on airflow intake with tall canopy trees and bushes in two different sections.
44points

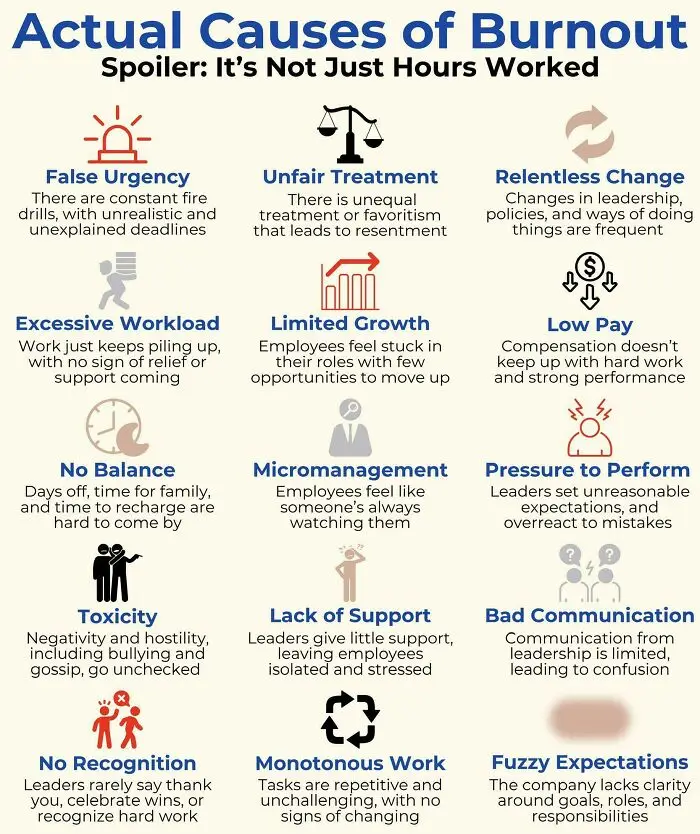
#12 Burnout Beyond The Clock

Chart showing actual causes of burnout with visuals highlighting workload, micromanagement, pay, support, and communication issues.
43points

The psychologist believes visual learning is so powerful that he embraces it in his teaching and writing, too.

"Each page in the psychology textbooks I coauthor has been individually formatted to maximize visual learning. Each lecture slide I use in class is presented in a way to make the most of visual learning," Kouyoumdjian says.
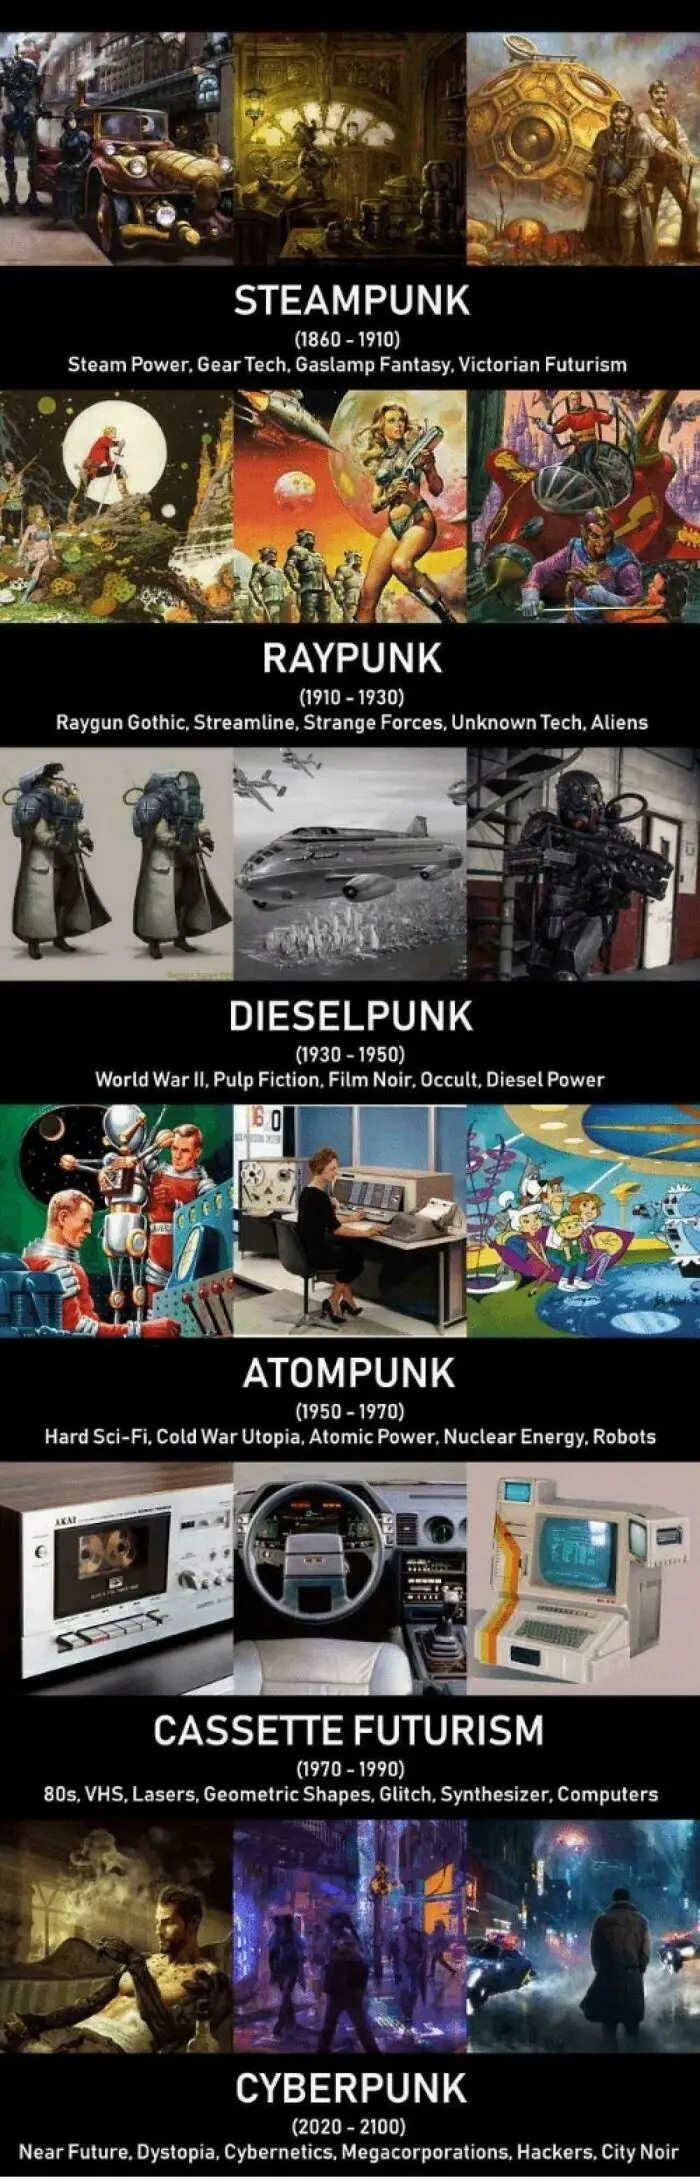
#13 Tech Through The Ages

Visual guide showcasing unique punk subgenres with charts and visuals explaining steampunk, raypunk, dieselpunk, atompunk, cassette futurism, and cyberpunk.
40points

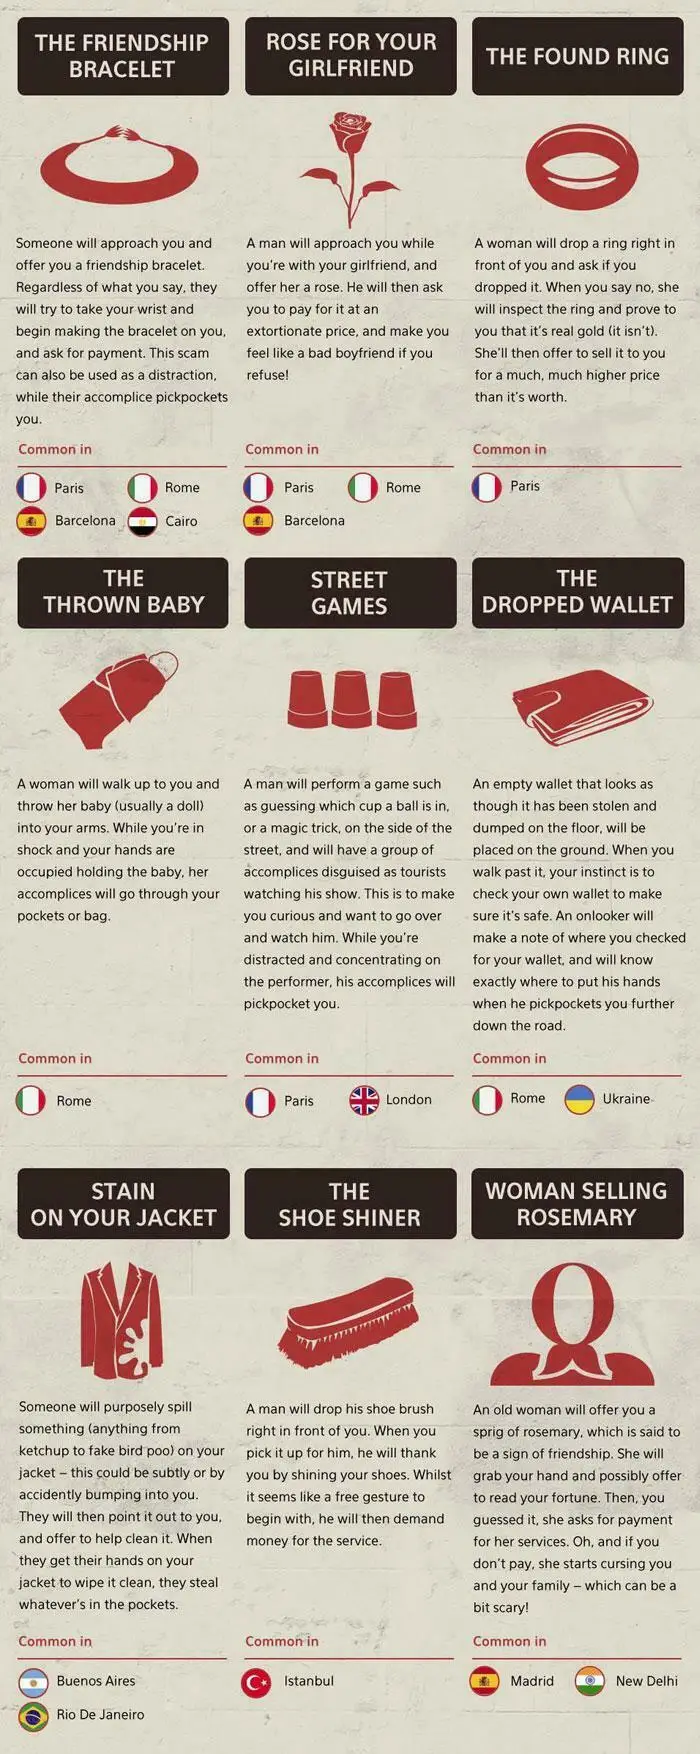
#14 Street Smarts 101

Visual guide showing common street scams and pickpocket tricks with illustrations and locations where they occur.
Report
40points

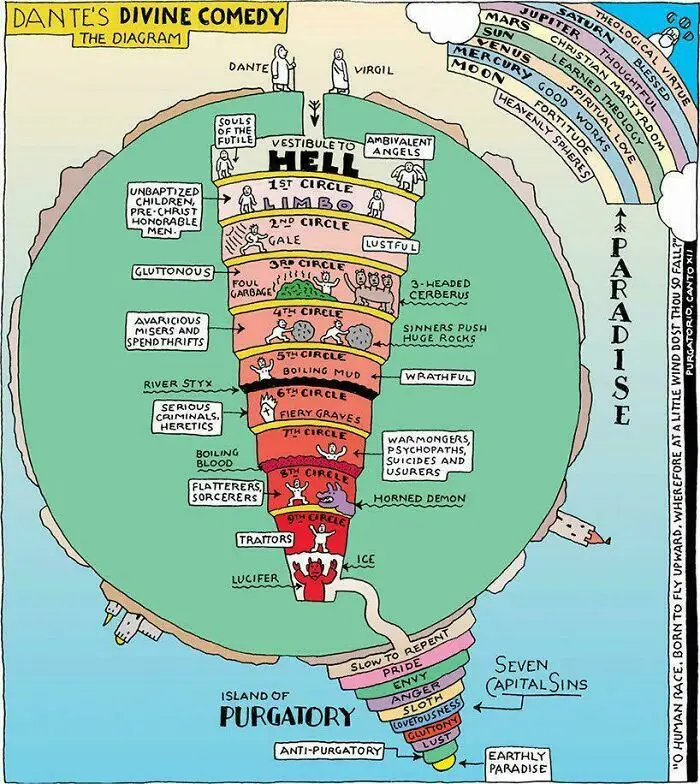
#15 Layers of Eternal Drama

Diagram of Dante's Divine Comedy illustrating Hell, Purgatory, and Paradise with labeled circles and seven capital sins.
35points

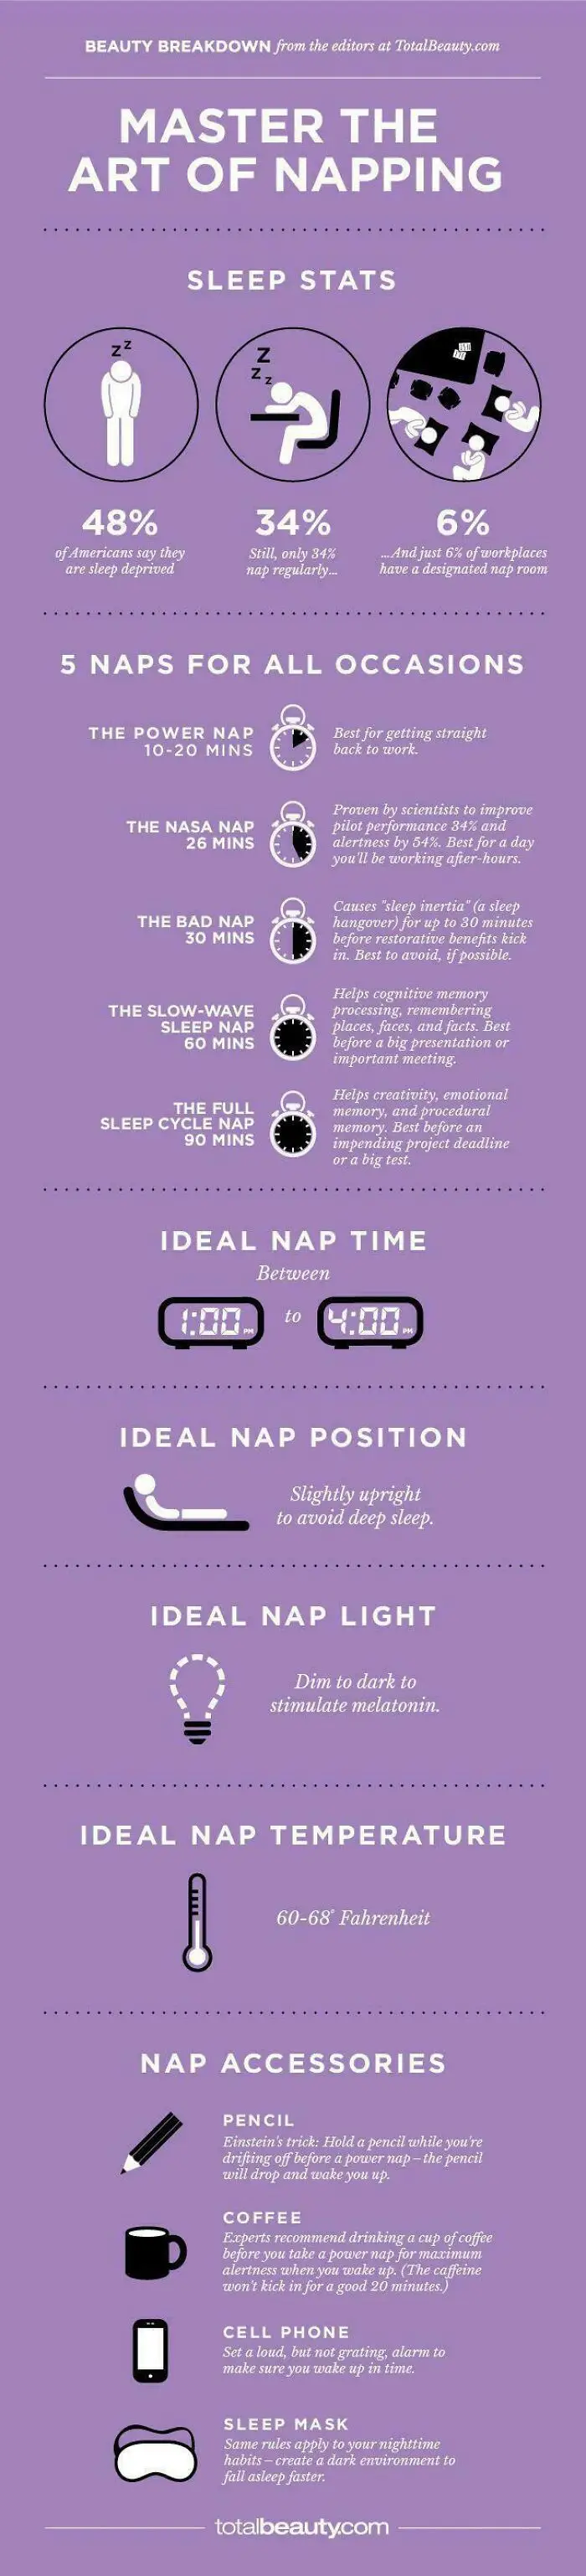
#16 Nap Like a Pro

Infographic on napping tips including sleep stats, ideal nap times, positions, light, temperature, and accessories.
Report
31points

Kouyoumdjian believes the right visuals can help make abstract and difficult concepts more tangible and welcoming, as well as make learning more effective and long-lasting. This is why he scrutinizes every visual he uses in his work—to make sure it is paired with content in a clear, meaningful manner.

#17 Snow Shoveling Made Simple

Diagram showing snow shoveling steps with red, blue, and green arrows demonstrating how to lift and push snow efficiently.
29points

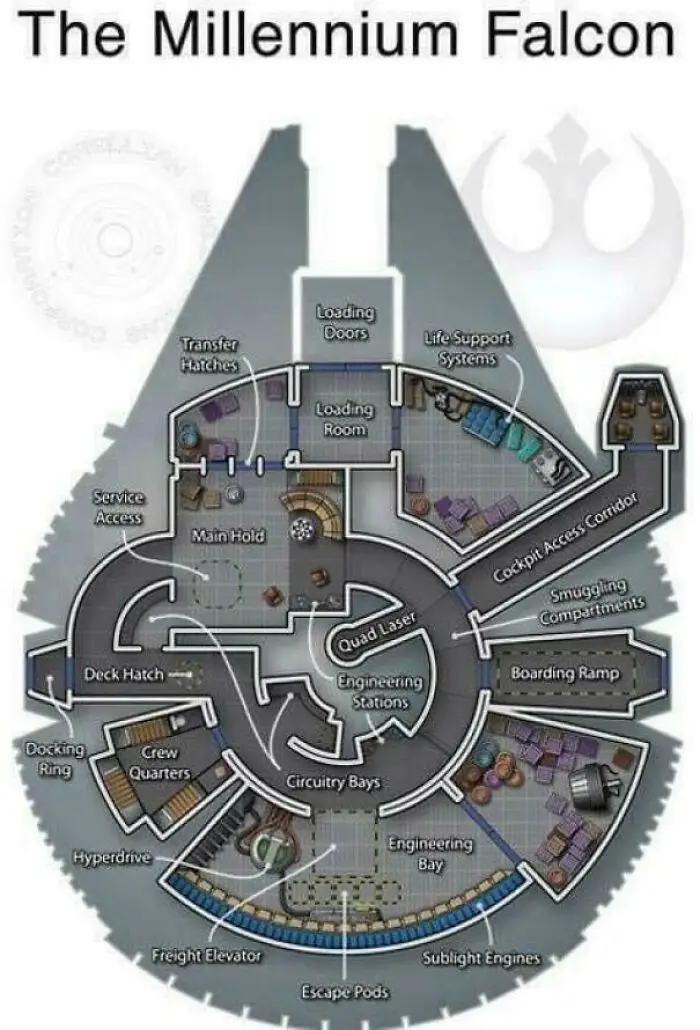
#18 Spaceship Secrets Uncovered

Diagram chart of the Millennium Falcon showcasing detailed interior layout with unique engineering and crew quarters sections.
26points

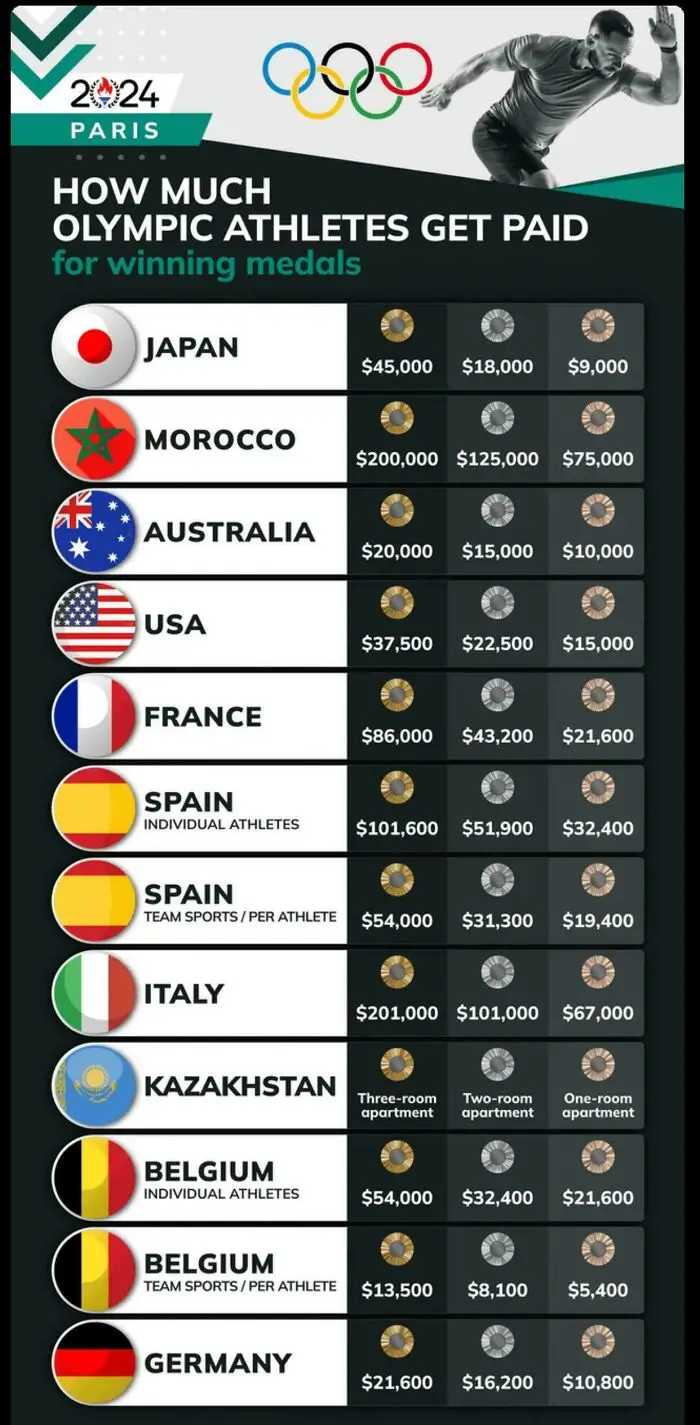
#19 Medal Money Matters

Chart showing how much Olympic athletes get paid for winning medals in various countries for 2024 Paris Games.
25points

#20 Geography Gets Weird

Map of unique and quirky place names across the United States shown in a colorful visual chart.
25points

"Based upon research outcomes, the effective use of visuals can decrease learning time, improve comprehension, enhance retrieval, and increase retention. In addition, the many testimonials I hear from my students and readers weigh heavily in my mind as support for the benefits of learning through visuals," Kouyoumdjian concludes.

You can view this list as sort of a mini experiment as well. For example, think about how little time it took you to scroll through the pictures and the vast amount of information you gathered from them. Pretty effective means of communication, don't you think?

62
20