




Visualization can be applied to pretty much any field; it helps to tell stories by curating data into a form that's easier to understand, highlighting any trends and outliers. And there's no place on the internet that is as obsessed with it as r/DataIsBeautiful.
The subreddit runs on a simple mission: to collect visualizations that effectively convey information. But the way its 16 million members go about it is anything but. There are no fake numbers, goofball statistics, and trivial analysis—just legitimate facts, portrayed in aesthetically pleasing ways. Such a delicate balance.
We at Bored Panda have already covered it once but when a community is that big, you know it's gonna keep delivering quality content so we just had to make an update. Enjoy!
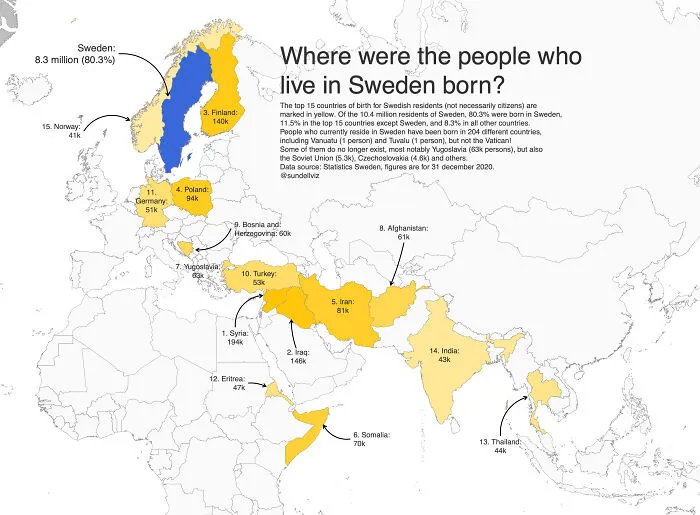
#21 The Top 15 Countries (Apart From Sweden) In Which The People Who Currently Live In Sweden Were Born
Report
0points
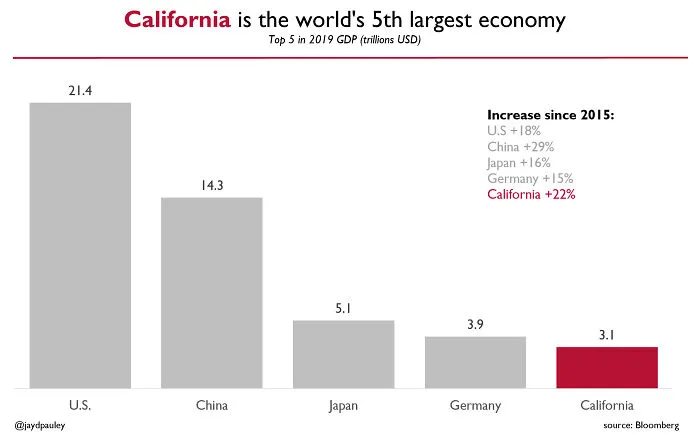
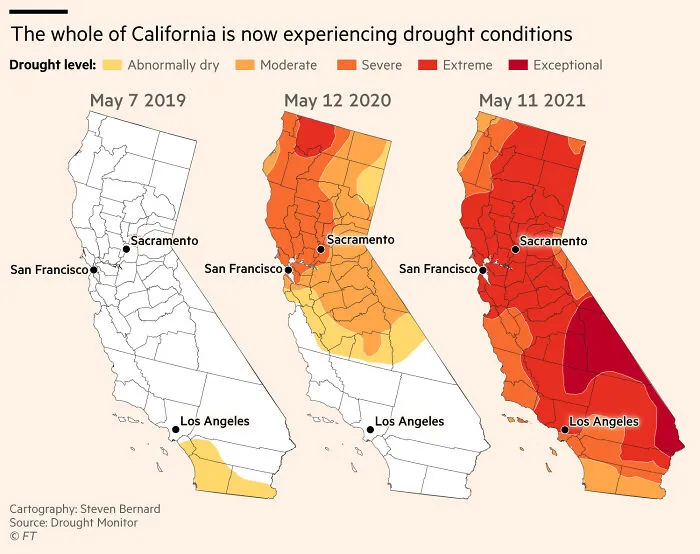
#23 Maps Showing Water Shortages During May Have Become Increasingly Extreme In California
Report
0points
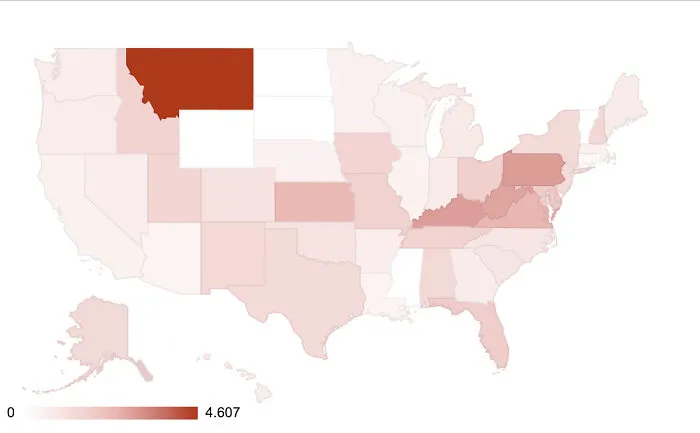
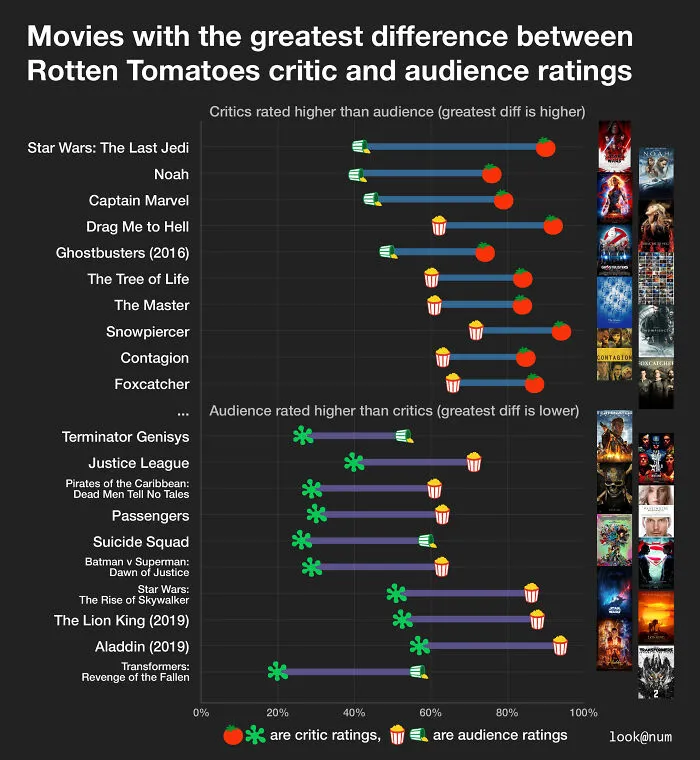
#28 Movies With The Greatest Difference Between Rotten Tomatoes Critic And Audience Ratings
Report
0points