




Visualization can be applied to pretty much any field; it helps to tell stories by curating data into a form that's easier to understand, highlighting any trends and outliers. And there's no place on the internet that is as obsessed with it as r/DataIsBeautiful.
The subreddit runs on a simple mission: to collect visualizations that effectively convey information. But the way its 16 million members go about it is anything but. There are no fake numbers, goofball statistics, and trivial analysis—just legitimate facts, portrayed in aesthetically pleasing ways. Such a delicate balance.
We at Bored Panda have already covered it once but when a community is that big, you know it's gonna keep delivering quality content so we just had to make an update. Enjoy!

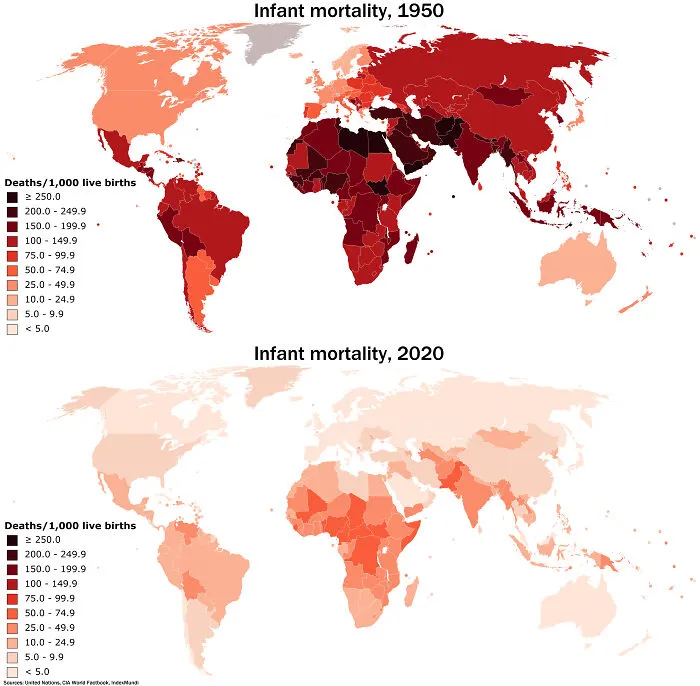
#3 The Massive Decrease In Worldwide Infant Mortality From 1950 To 2020 Is Perhaps One Of Humanity's Greatest Achievements
Report
0points

#5 Countries With A Higher Life Expectancy Than The United States (World Health Organization 2019)

Report
0points
#6 This Map Shows All Of The Earthquakes With A Magnitude Greater Than 5.0 Over The Last 20 Years

Report
0points



#14 "What Is One Country That You Will Never Visit Again?" Answers From R/Askreddit

Report
0points

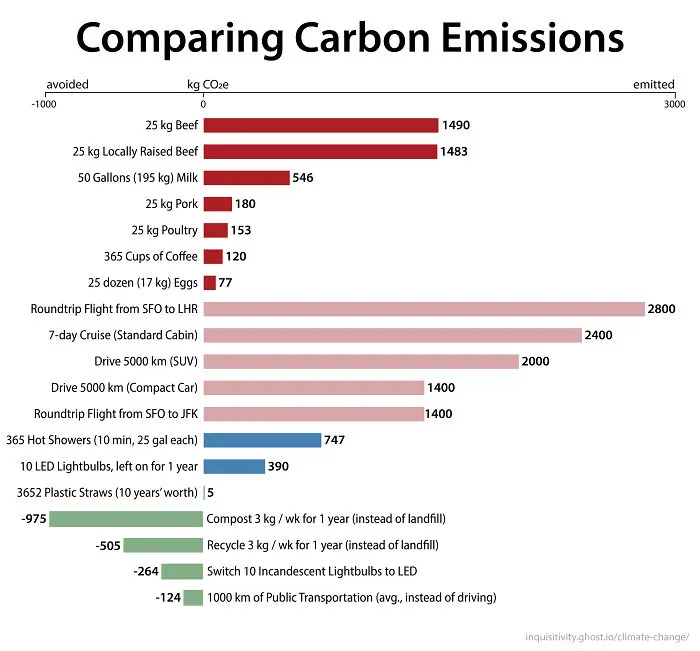
#16 Comparing Emissions Sources - How To Shrink Your Carbon Footprint More Effectively
Report
0points
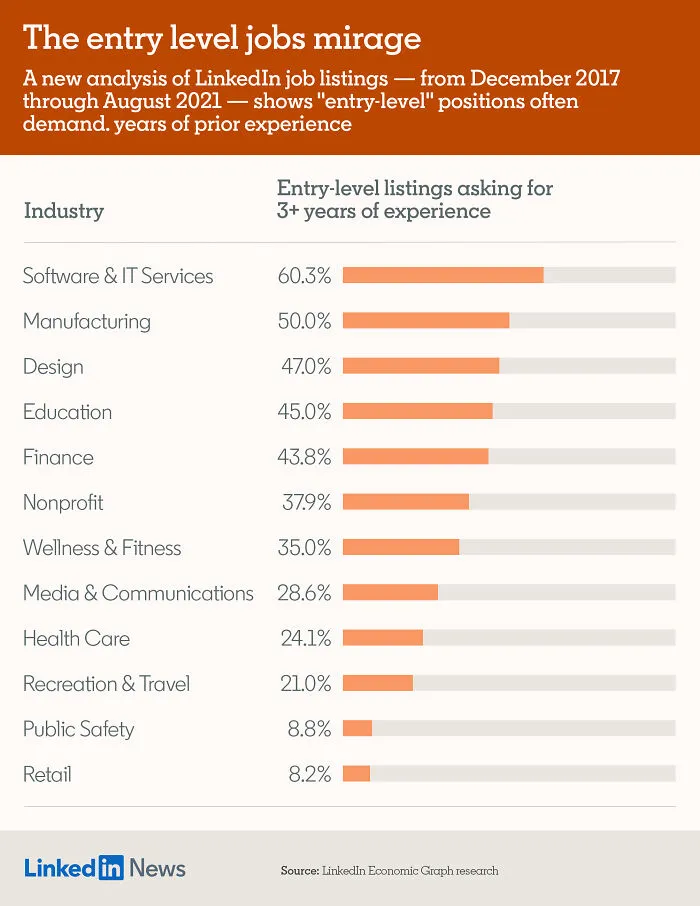
#18 Where Are The World's Airports? This Map Shows Locations Of The Worlds Airports And Heliports

Report
0points

#20 Knight Moves - A Simple Table I Made Showing The Importance Of Keeping Your Knights Near The Middle Of The Chessboard

Report
0points