



Bored Panda
52 Clever Visual Guides That Make You Feel Smarter In Minutes
CuriositiesJUL 4, 2026

52 Clever Visual Guides That Make You Feel Smarter In Minutes

44
6
People love to learn, but we don’t really like it when it’s hard. Luckily, some ways to learn are easier than others. Research shows that we’re more likely to engage with new information when it’s presented in more fun ways than just plain text. For example, we understand graphs 25.5% faster than text and 46.5% faster than data in tables.
If that’s really so, then you’ll probably love this list of cool charts and guides, Pandas! We’ve collected some of the most interesting and visually pleasing graphs from several Instagram pages about our world: pop culture, wildlife, population density, obesity, and many more. So, if you’d like to learn the types of the most common errors online, symptoms of COVID-19, and what cleaning products you should never mix, but presented in a cool way, then this is just for you.
#41

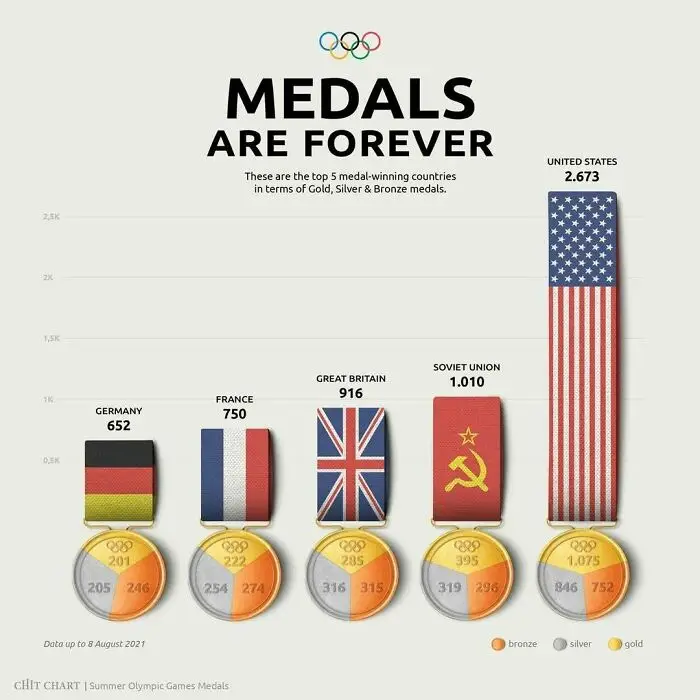
Chart illustrating how to decide faster by comparing Olympic gold, silver, and bronze medals by country.
5points

#42

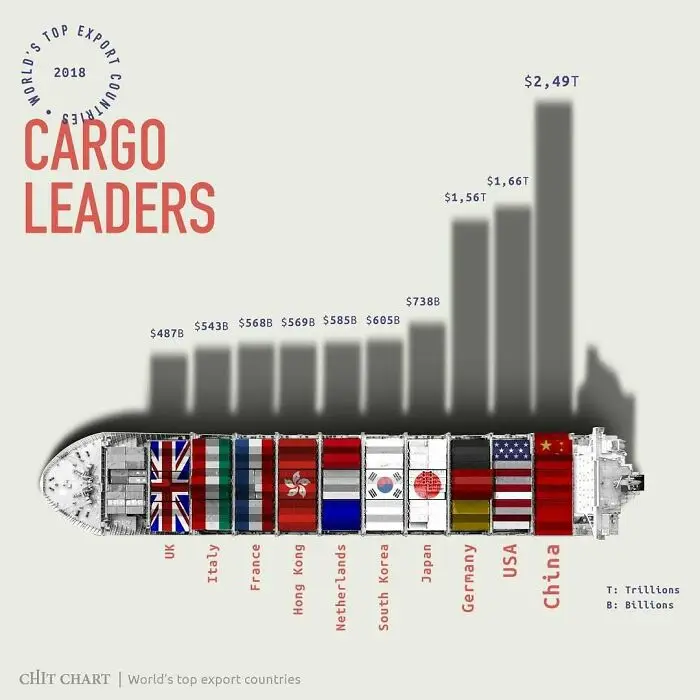
A chart illustrating top cargo export countries, simplifying complex global trade data.
5points

#43

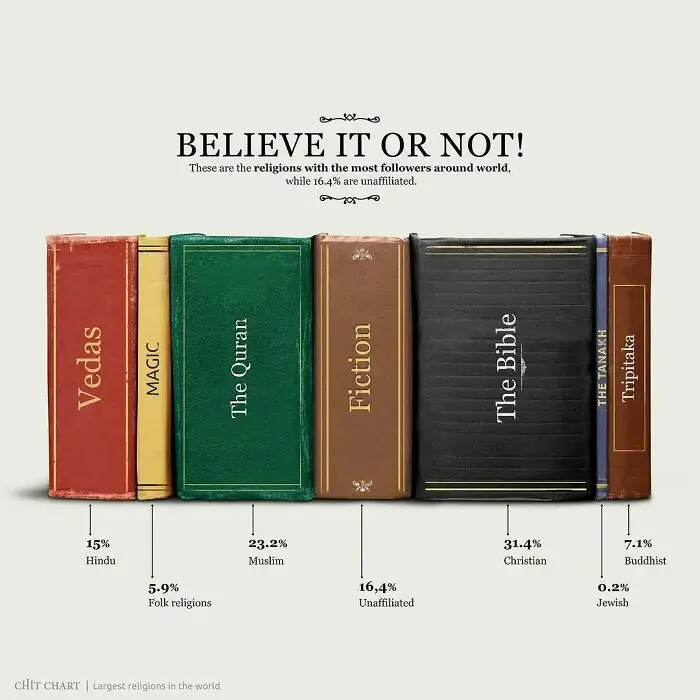
A chart showing major religions worldwide, including Hinduism, Folk religions, Islam, Unaffiliated, Christianity, Judaism, and Buddhism.
4points

#44

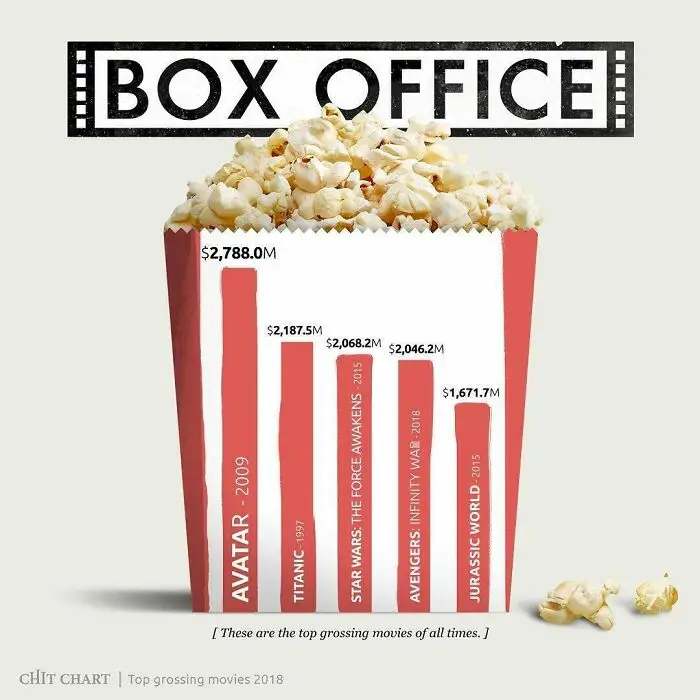
A chart showing top grossing movies at the box office, simplifying complex entertainment data.
4points

#45

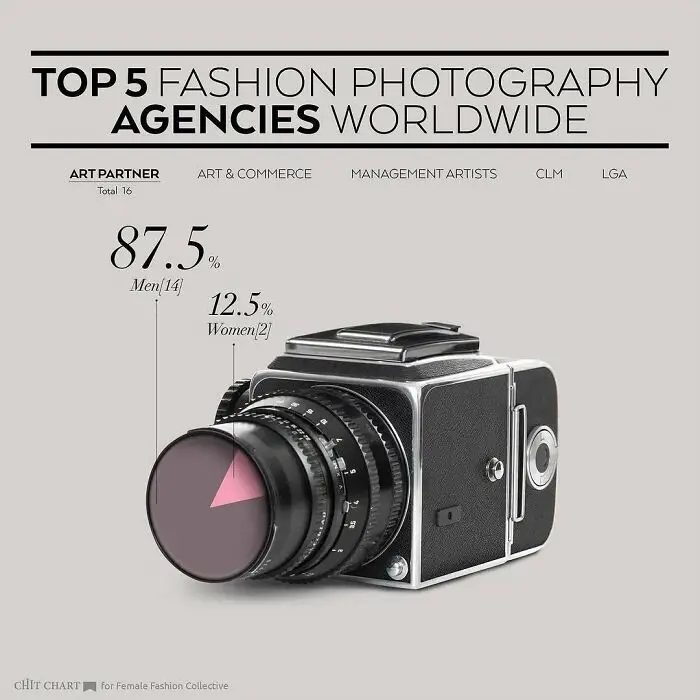
Chart detailing top fashion photography agencies and gender representation, aids in understanding industry trends to decide faster.
3points

#46

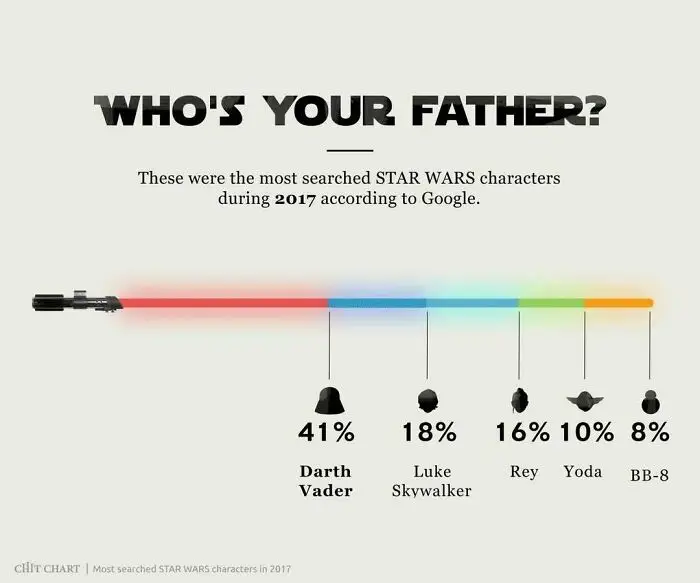
Charts showing the most searched Star Wars characters in 2017 to help decide faster on fan interest.
2points

#47

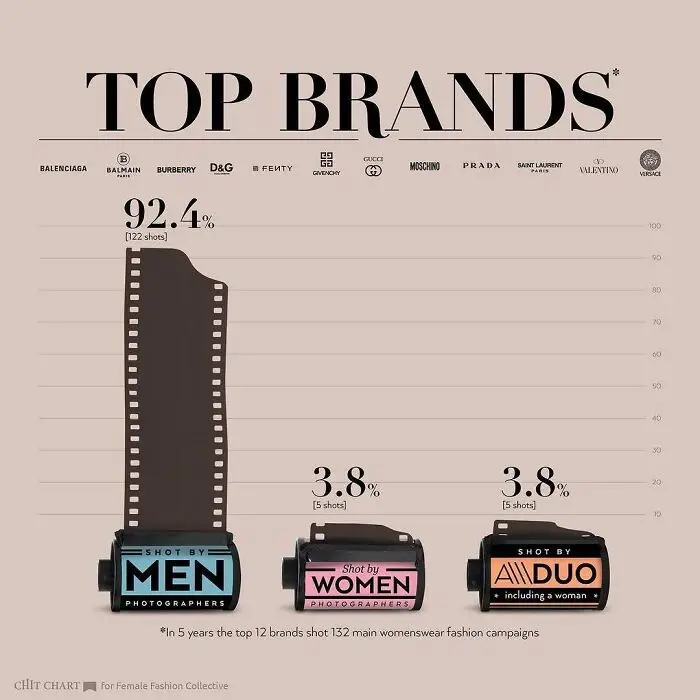
Charts comparing top fashion brands and photographers by gender to help decide faster on campaign diversity.
2points

#48

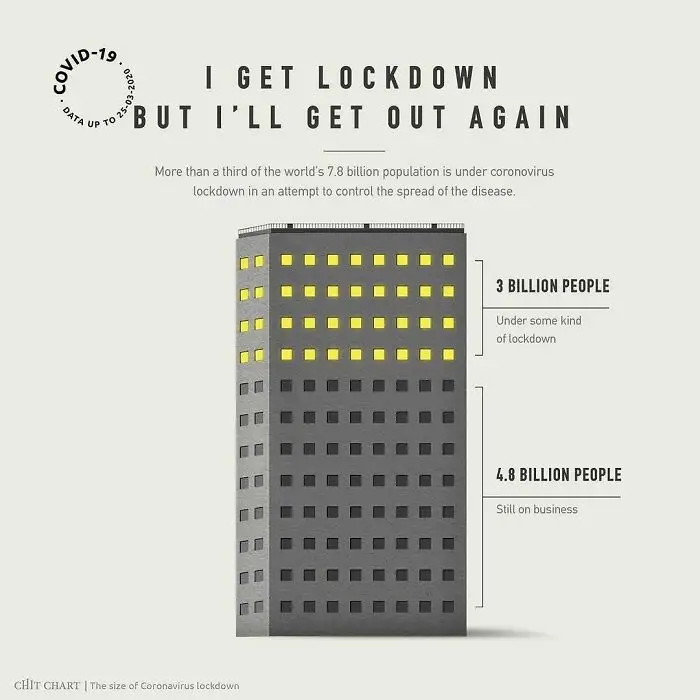
Chart explaining how to decide faster by visualizing global population under coronavirus lockdown.
1point

#49

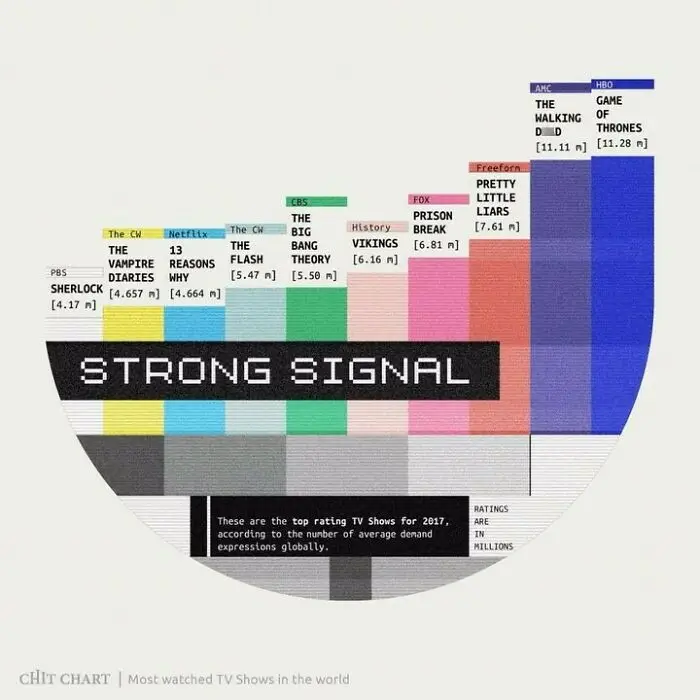
A chart showing top-rated TV shows of 2017, displaying strong signal data to help decide faster.
1point

#50

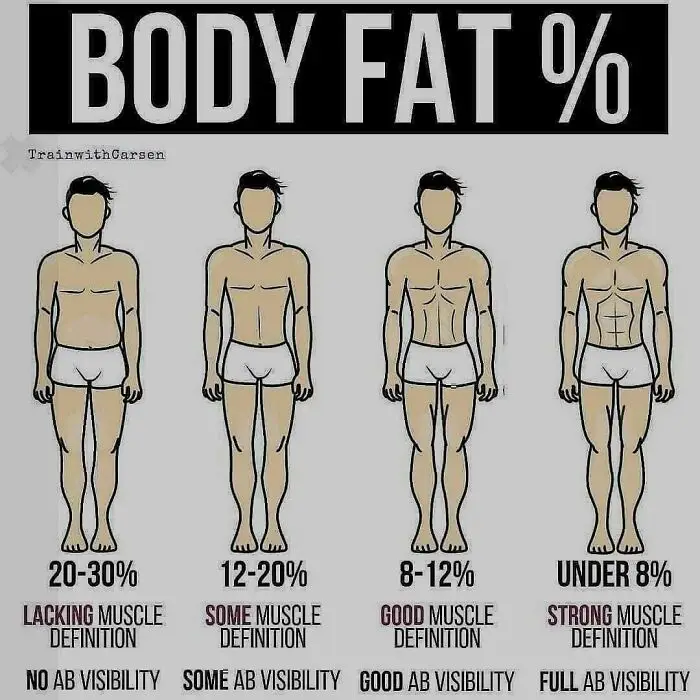
A body fat percentage chart to decide faster about muscle definition and visibility of abs at various percentages.
-2points

#51

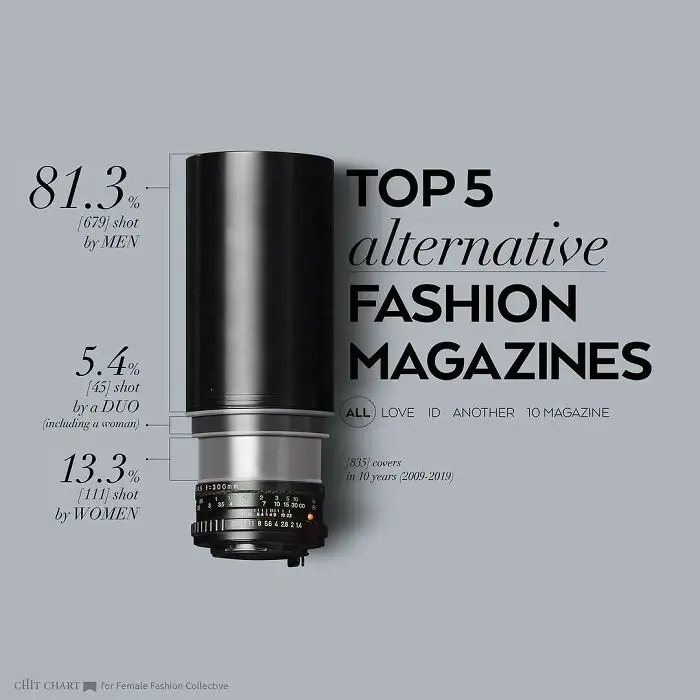
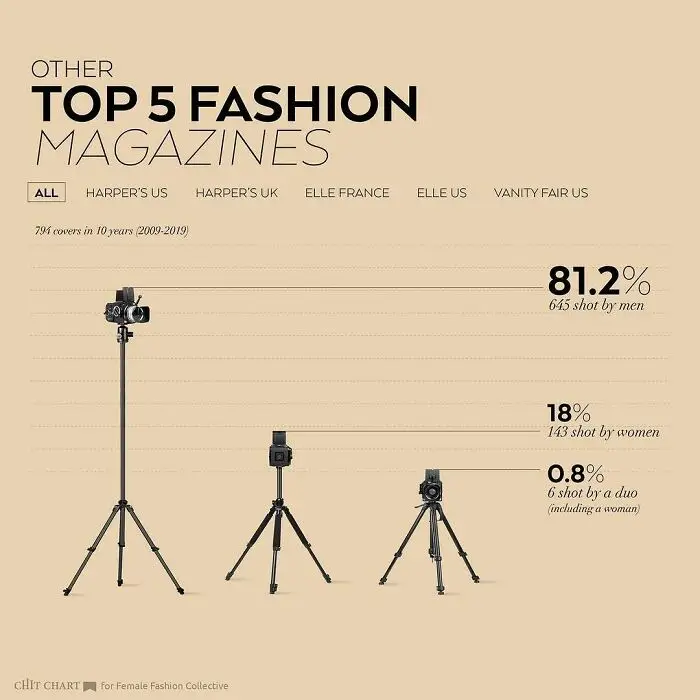
A chart that helps to decide faster by showing gender statistics for fashion magazine photography.
-3points

#52

Chart illustrating how to decide faster by analyzing shooting gender in top 5 fashion magazines.
-5points
44
6