



Bored Panda
52 Clever Visual Guides That Make You Feel Smarter In Minutes
CuriositiesJUL 4, 2026

52 Clever Visual Guides That Make You Feel Smarter In Minutes

44
6
People love to learn, but we don’t really like it when it’s hard. Luckily, some ways to learn are easier than others. Research shows that we’re more likely to engage with new information when it’s presented in more fun ways than just plain text. For example, we understand graphs 25.5% faster than text and 46.5% faster than data in tables.
If that’s really so, then you’ll probably love this list of cool charts and guides, Pandas! We’ve collected some of the most interesting and visually pleasing graphs from several Instagram pages about our world: pop culture, wildlife, population density, obesity, and many more. So, if you’d like to learn the types of the most common errors online, symptoms of COVID-19, and what cleaning products you should never mix, but presented in a cool way, then this is just for you.
#21

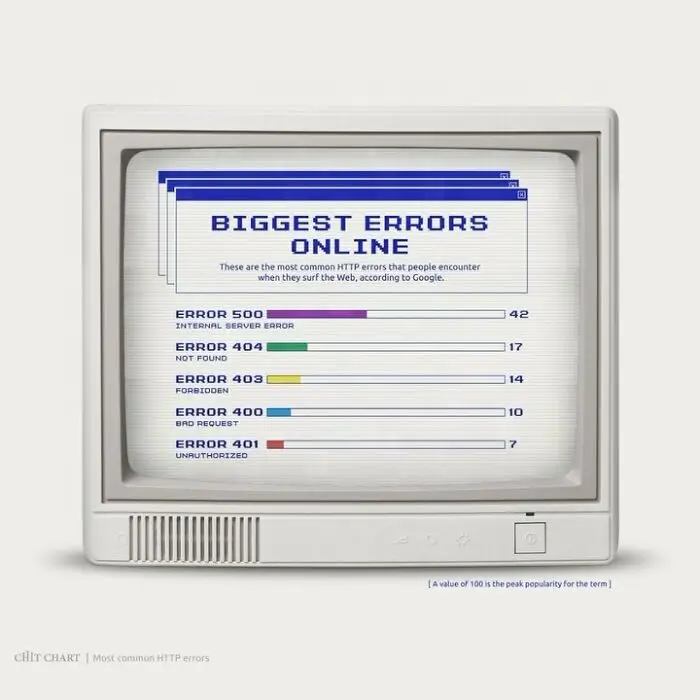
Chart displaying common HTTP errors to help decide faster on troubleshooting online issues.
11points

#22

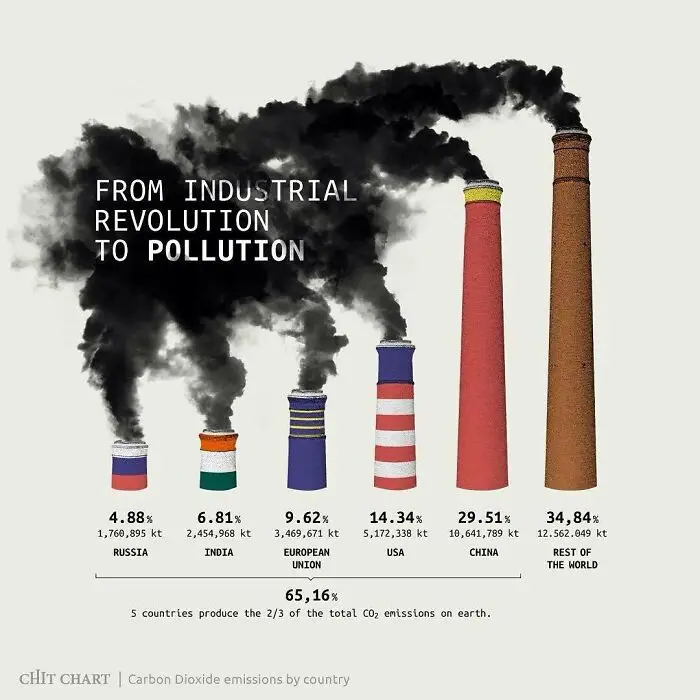
Chart explaining how to decide faster by visualizing pollution from the industrial revolution.
10points

#23

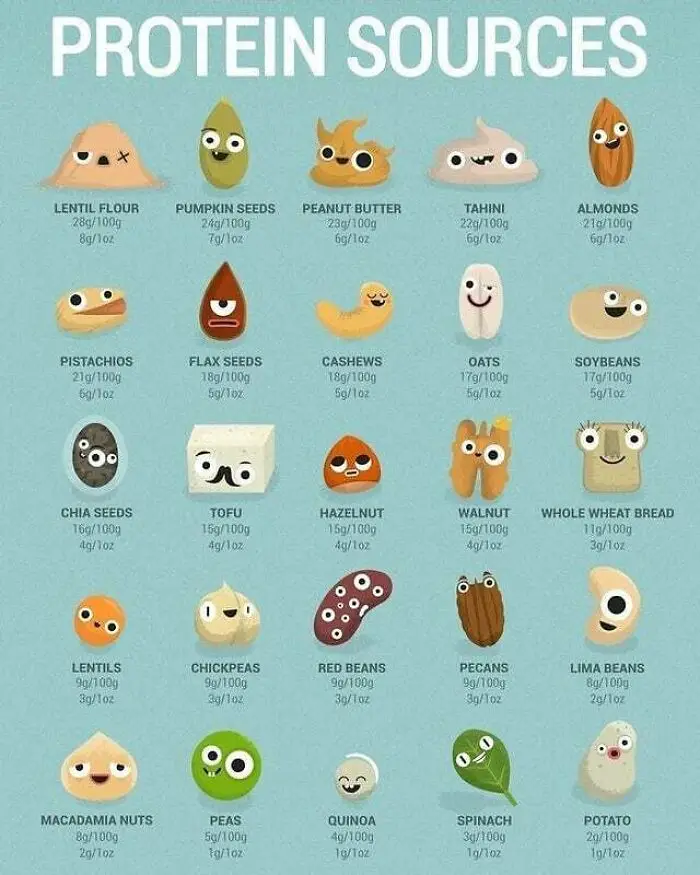
A chart of various protein sources like lentils, pumpkin seeds, and almonds, helping decide faster.
10points

#24

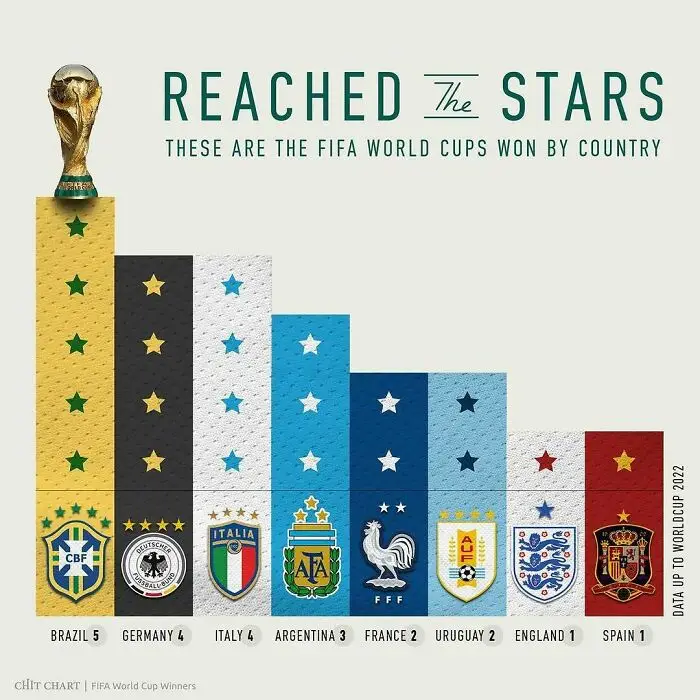
A chart illustrating FIFA World Cup wins by country, showing Brazil, Germany, Italy, Argentina, France, Uruguay, England, and Spain.
9points

#25

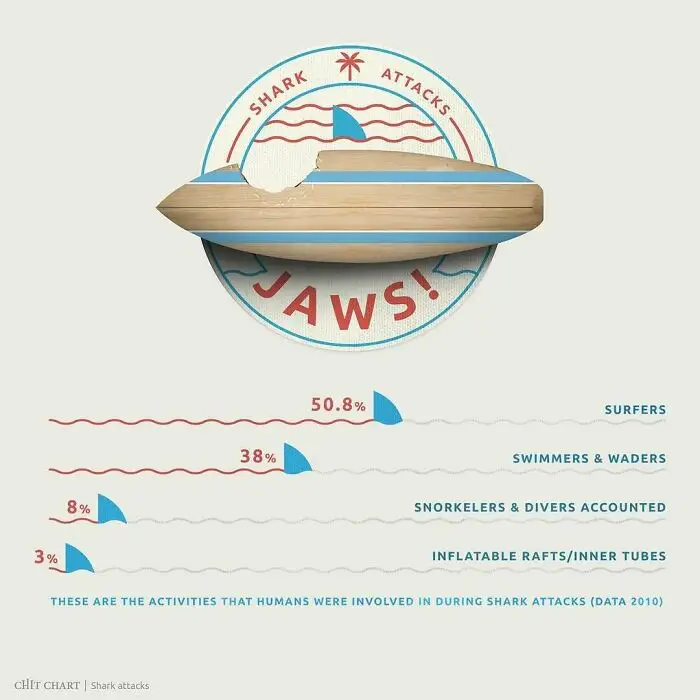
A chart detailing shark attacks by human activity, including surfers, swimmers & waders, snorkelers & divers, and inflatable rafts.
9points

#26

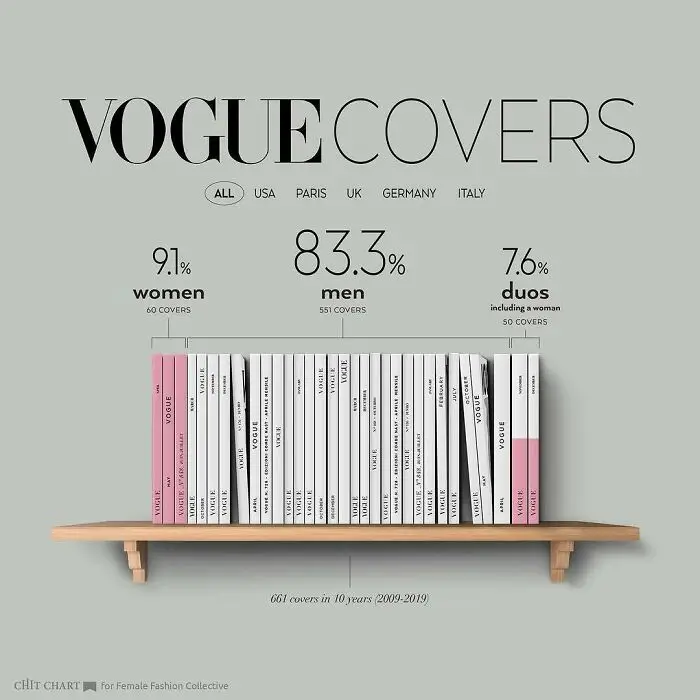
A chart displaying Vogue magazine covers from 2009-2019, detailing the percentage of women, men, and duos featured.
9points

#27

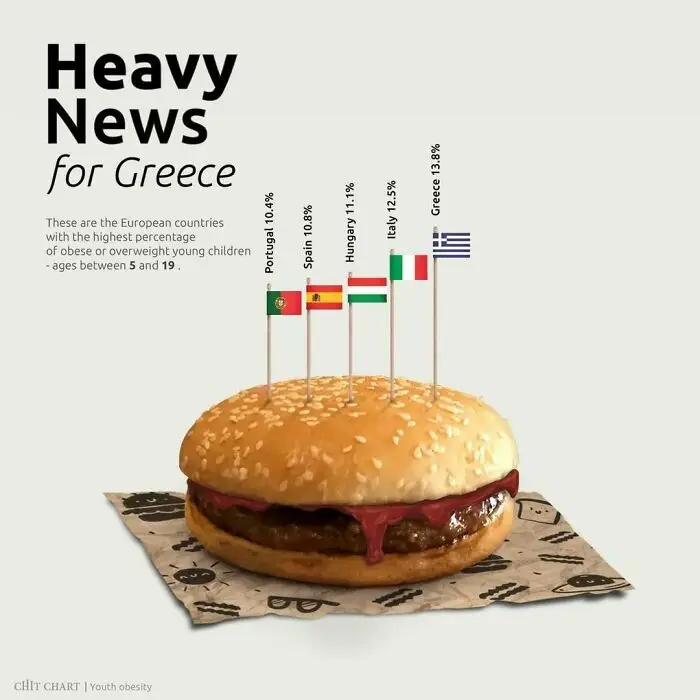
Chart illustrating countries with highest percentage of child obesity, helping to decide faster on health initiatives.
9points

#28

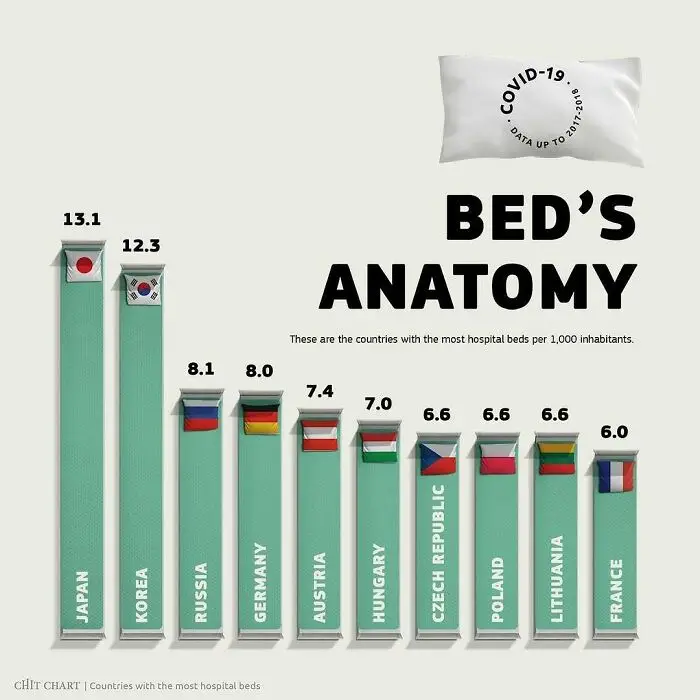
Chart explaining how to decide faster with a visual representation of hospital beds by country.
9points

#29

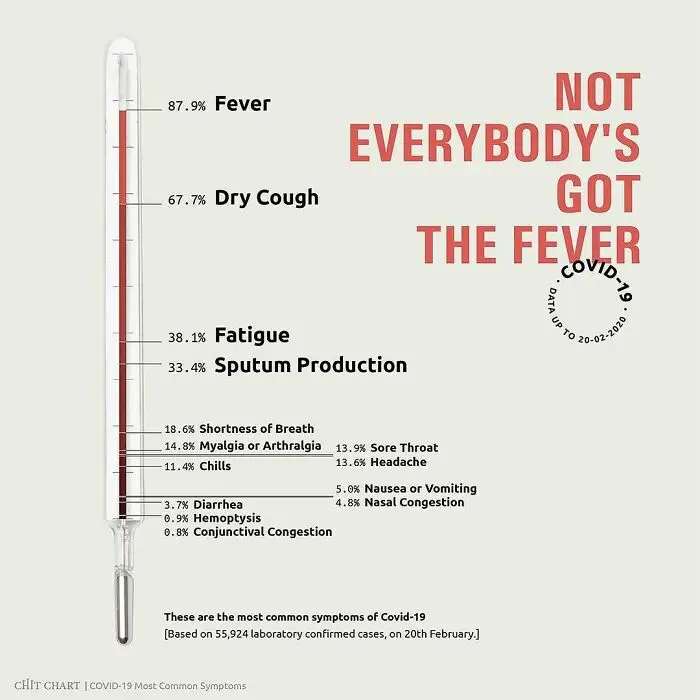
A chart detailing Covid-19 symptoms with percentages, simplifying complex health information.
9points

#30

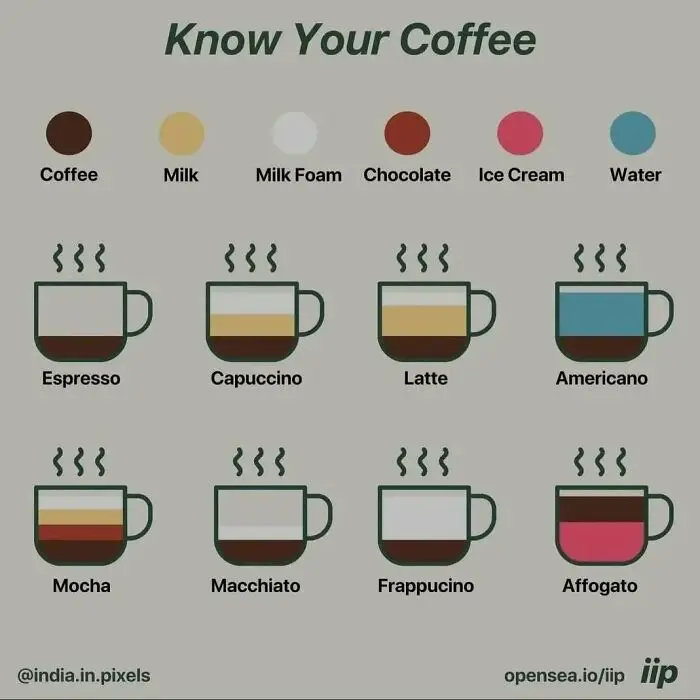
A chart explaining different types of coffee, a complex topic, to help decide faster what to drink.
9points

#31

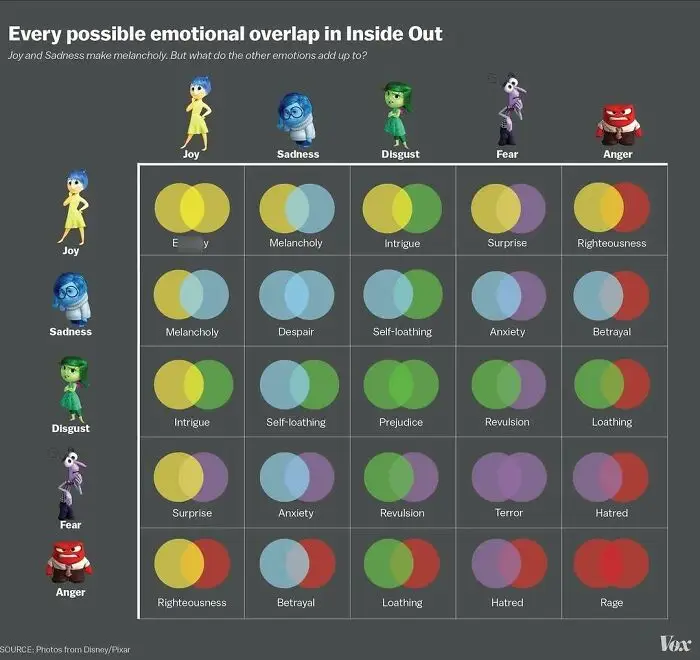
A chart showing emotional overlaps in Inside Out to help understand complex emotions and decide faster.
8points

#32

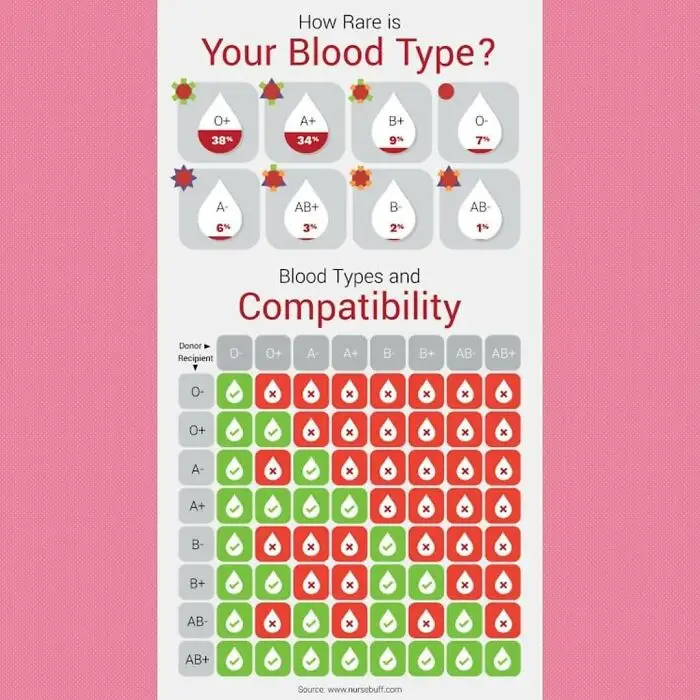
A detailed chart about blood types and compatibility, displaying percentages for quick decision-making.
7points

#33

An Oscar statue atop a podium, ranking actors/actresses by Academy Award nominations, to decide faster.
7points

#34

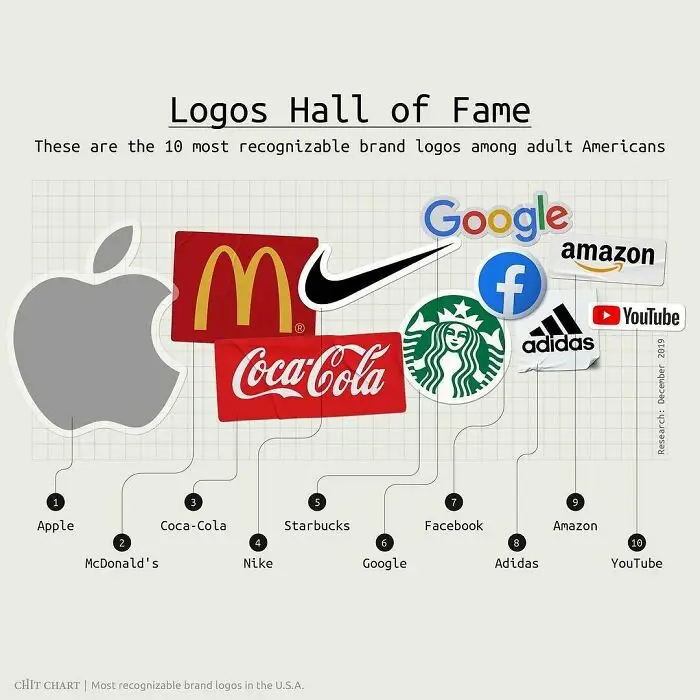
A chart showcasing the top 10 most recognizable brand logos in the USA, featuring Apple, McDonald's, Coca-Cola, and others.
6points

#35

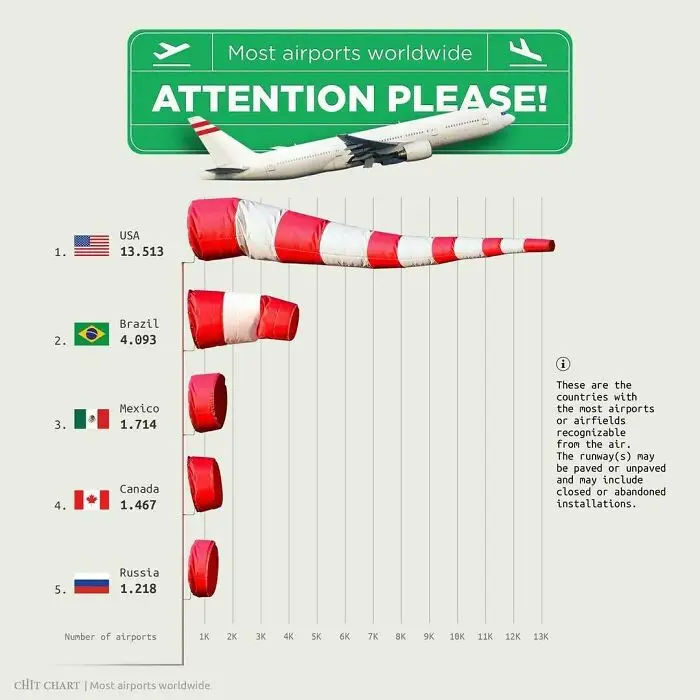
Charts displaying countries with the most airports worldwide to help decide faster on aviation logistics.
6points

#36

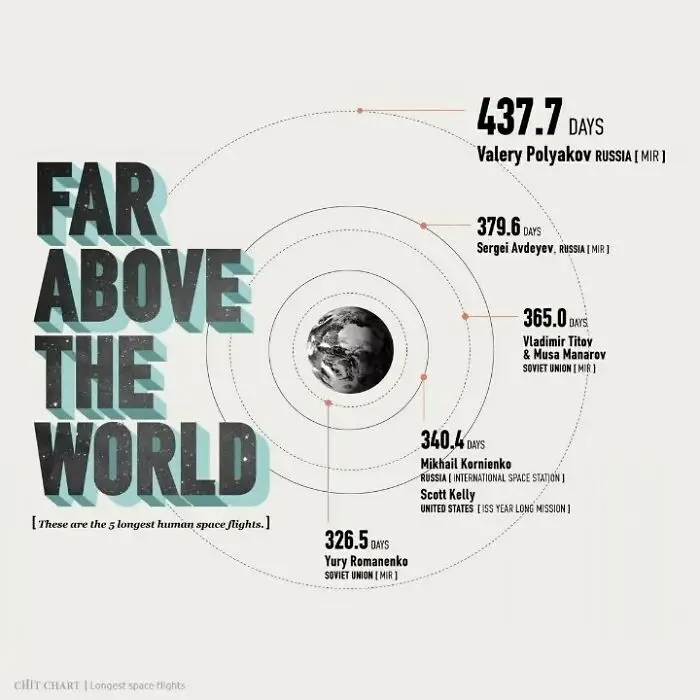
Chart illustrating the longest human space flights to help decide faster on space mission durations.
6points

#37

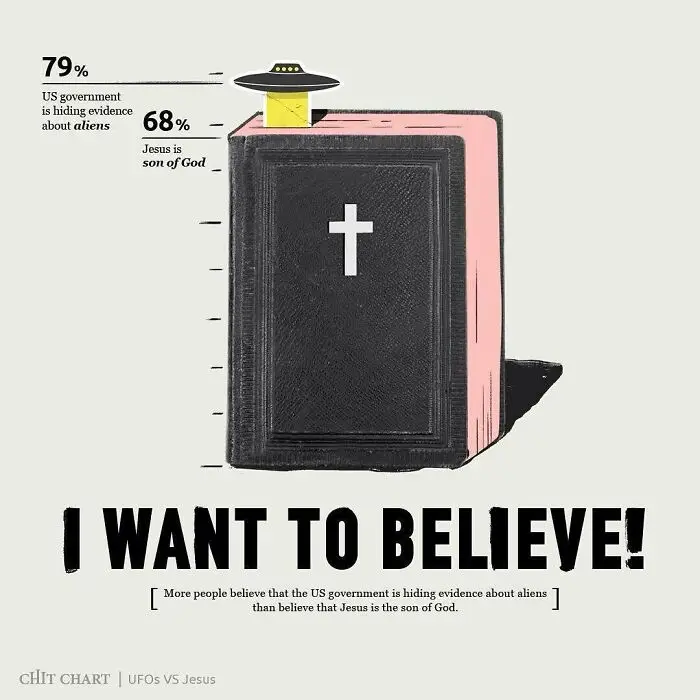
A chart visually compares public beliefs about aliens and religious figures, simplifying complex ideas.
6points

#38

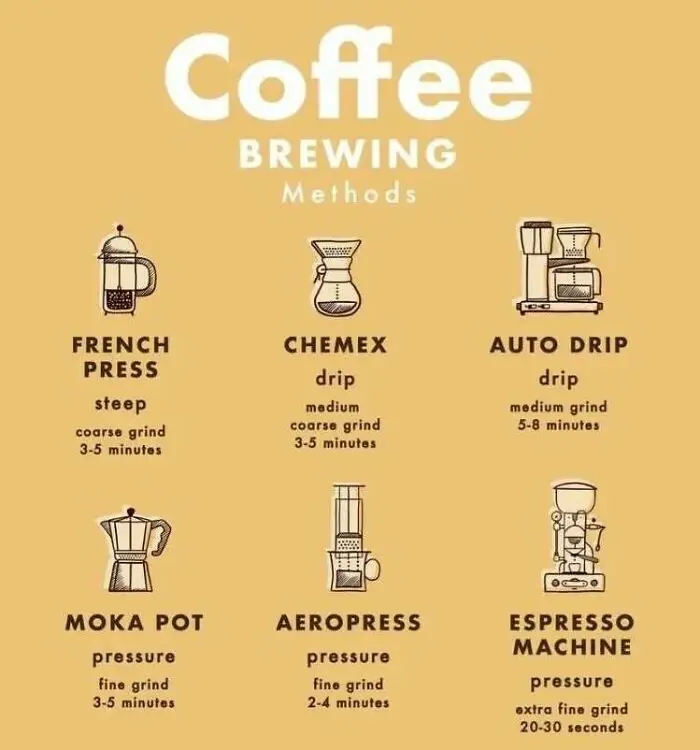
A chart to decide faster by illustrating different coffee brewing methods and their characteristics.
6points

#39

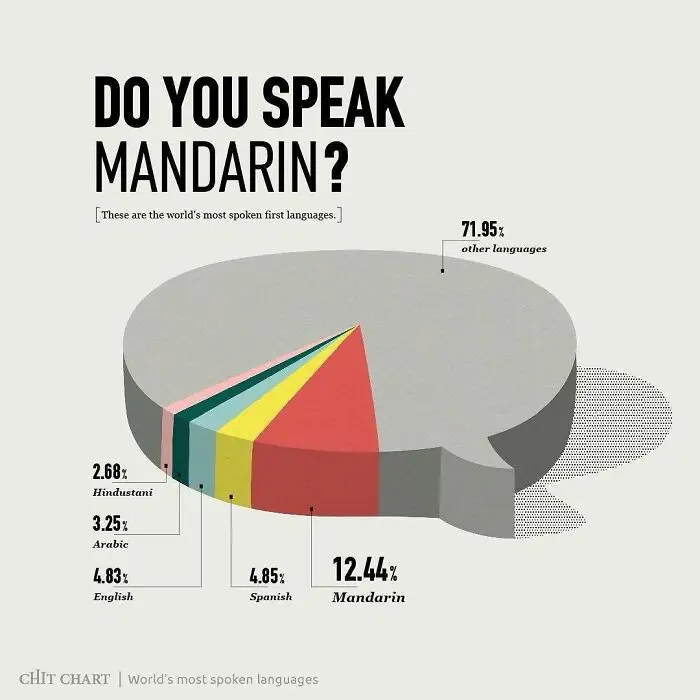
A pie chart illustrating the world's most spoken first languages, helping viewers to decide faster.
6points

#40

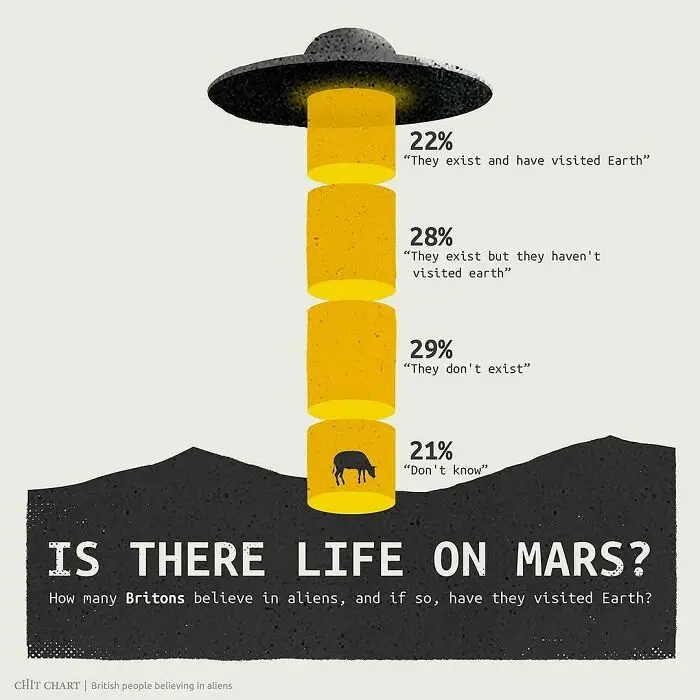
Charts depicting British beliefs about aliens and life on Mars to help decide faster on public opinion.
5points
44
6