

Bored Panda
30 Brilliantly Designed Infographics That Will Actually Teach You Something
CuriositiesAPR 11, 2025

30 Brilliantly Designed Infographics That Will Actually Teach You Something

23
3
Remember when encyclopedias were our go-to source for world knowledge? If that's the case, it's time to take an ibuprofen for your back... Today's information explosion delivers fascinating facts at lightning speed, but often as overwhelming walls of text that our brains simply skim past. That's where these brilliant infographics come to the rescue. They transform complex information into visual stories our minds actually want to absorb.
Colors, shapes, and clever illustrations work together to make learning effortless and—dare we say it—genuinely fun! From showing how the alphabet evolved to visualizing how to find the best watermelon, these thirty masterfully designed infographics turn data into discovery. Each one distills information down to its most engaging essence, proving once again that a well-crafted image truly is worth a thousand words. Whether you're a visual learner or just appreciate smart design, these infographics reveal fascinating world facts in ways that simply stick with you.
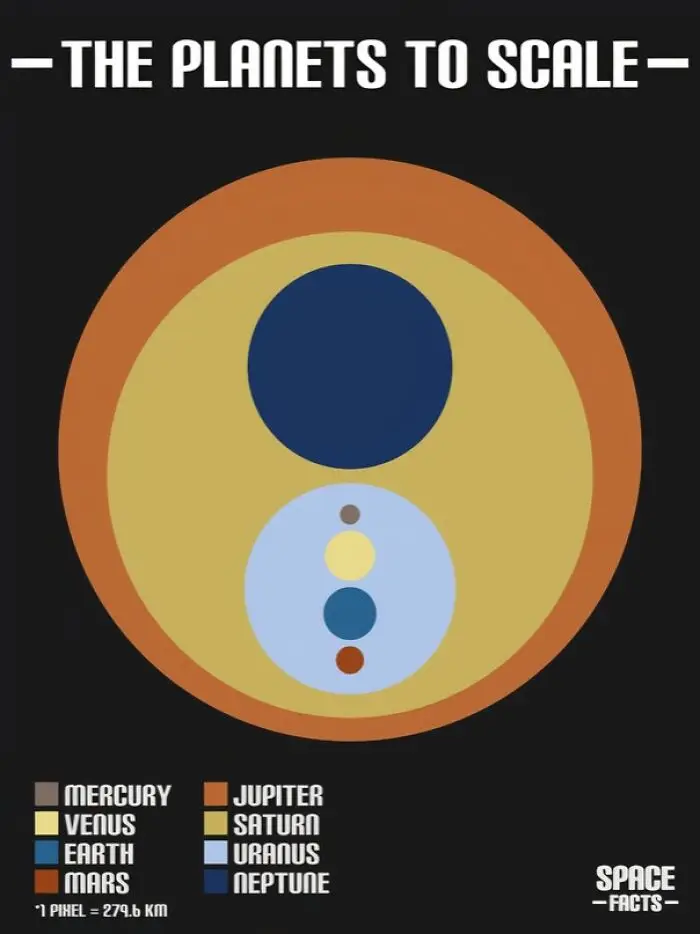
#21 The Planets To Scale

Infographic of planets to scale with colorful circles, illustrating relative sizes of the solar system planets.
Report
9points

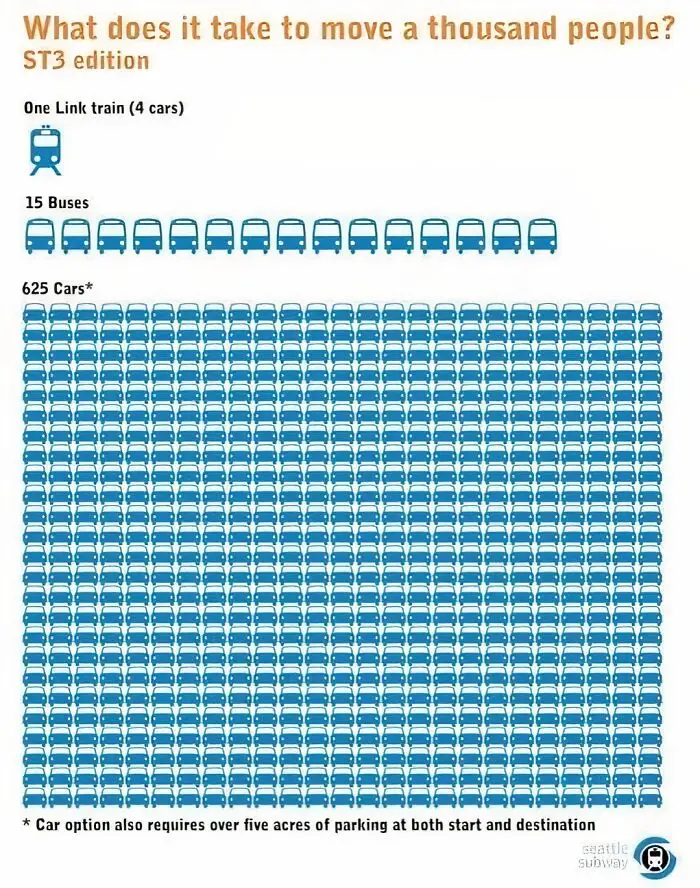
#22 What Do You Use Most?

Infographic comparing transportation efficiency: one train, 15 buses, 625 cars for 1,000 people.
Report
9points

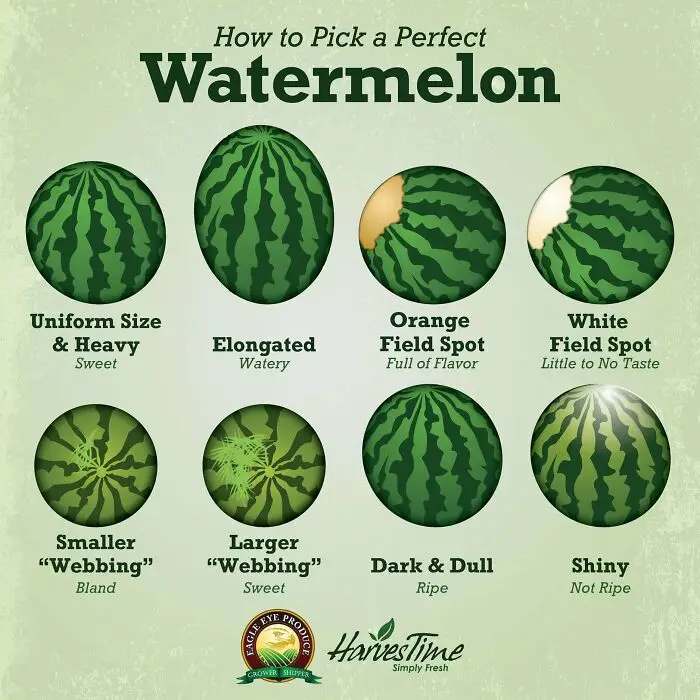
#23 If Only We Could Get One For Avocados

Infographic on choosing the perfect watermelon, highlighting size, shape, field spots, and webbing for best flavor.
Report
9points

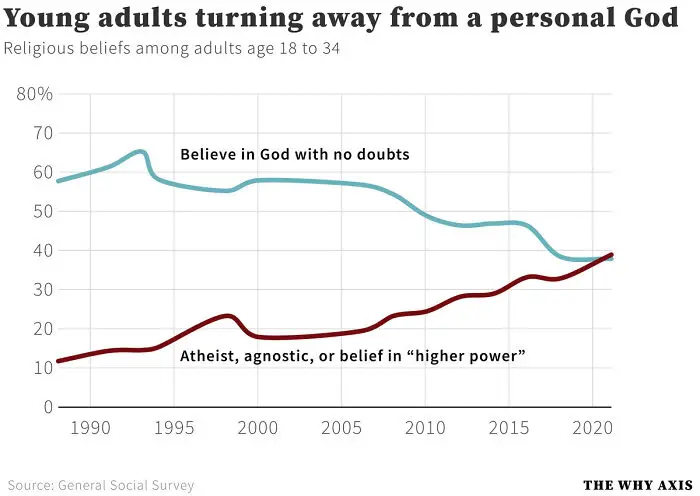
#24 Decline Of Faith Amongst Young American Adults

Infographic showing trends in religious beliefs among young adults from 1990 to 2020, highlighting shifts in theism and atheism.
9points

#25 U.S. Flag But Each Star Is Scaled Proportionally To Their State’s Population, In Roughly It’s Geographical Position

Stylized American flag design infographic with scattered stars.
Report
8points

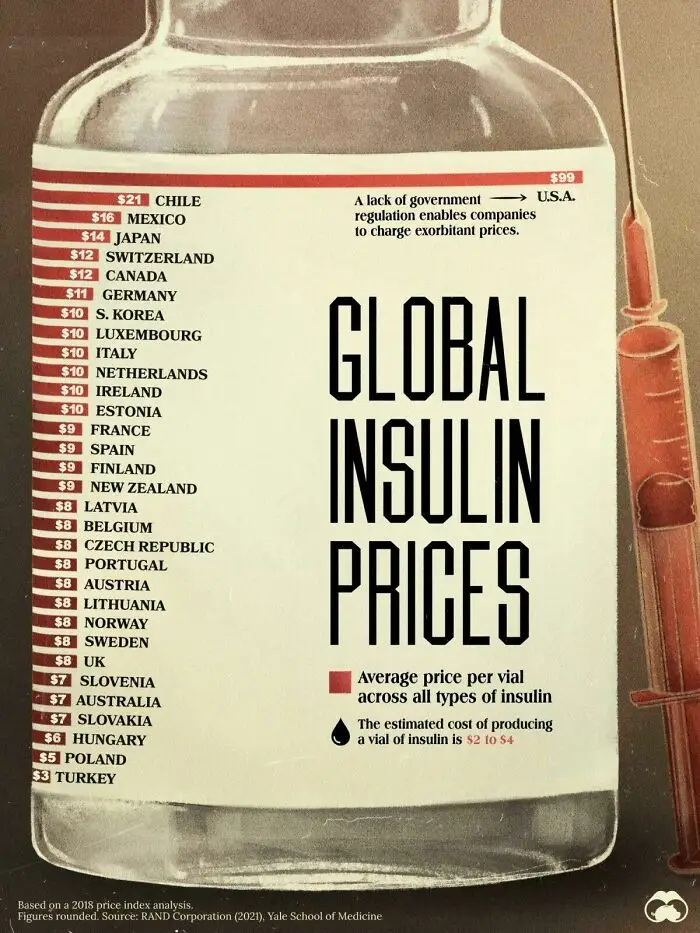
#26 The Average Cost Of Insulin By Country

Infographic comparing global insulin prices, highlighting the disparity in costs by country.
Report
7points

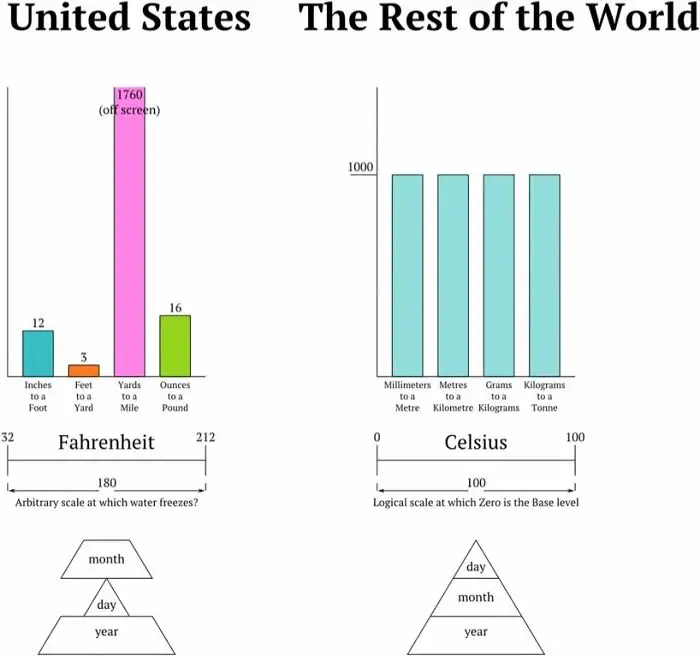
#27 Measure System In The United States And In The Rest Of The World

Infographic comparing US and international measurement systems, featuring Fahrenheit vs. Celsius scales and unit conversions.
7points

#28 Long Exposure Of A Roomba Vacuum With A Color Changing Light On Top

Colorful light patterns on a bedroom floor, creating an artistic visual effect.
Report
6points

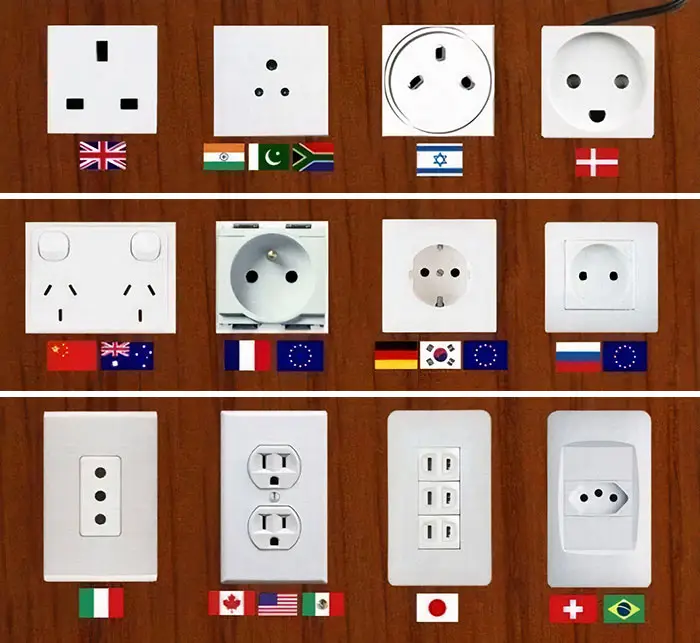
#29 Different Electrical Outlets Per Countries

Various international power sockets and plugs displayed with corresponding country flags for educational infographics.
6points

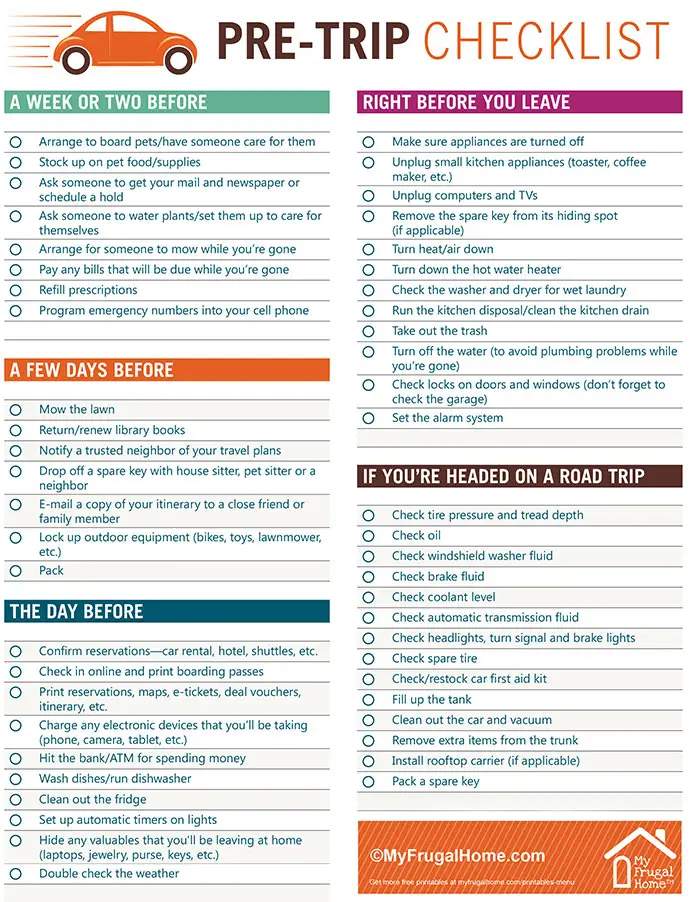
#30 Pre-Trip Checklist

Infographic of a pre-trip checklist including tasks like pet care, unplugging appliances, and car maintenance.
Report
6points
23
3