

Bored Panda
30 Brilliantly Designed Infographics That Will Actually Teach You Something
CuriositiesAPR 11, 2025

30 Brilliantly Designed Infographics That Will Actually Teach You Something

23
3
Remember when encyclopedias were our go-to source for world knowledge? If that's the case, it's time to take an ibuprofen for your back... Today's information explosion delivers fascinating facts at lightning speed, but often as overwhelming walls of text that our brains simply skim past. That's where these brilliant infographics come to the rescue. They transform complex information into visual stories our minds actually want to absorb.
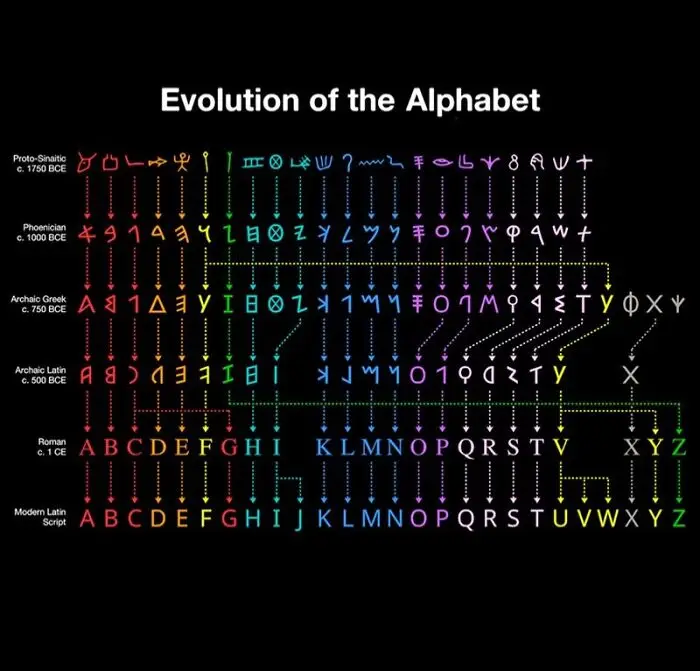
Colors, shapes, and clever illustrations work together to make learning effortless and—dare we say it—genuinely fun! From showing how the alphabet evolved to visualizing how to find the best watermelon, these thirty masterfully designed infographics turn data into discovery. Each one distills information down to its most engaging essence, proving once again that a well-crafted image truly is worth a thousand words. Whether you're a visual learner or just appreciate smart design, these infographics reveal fascinating world facts in ways that simply stick with you.
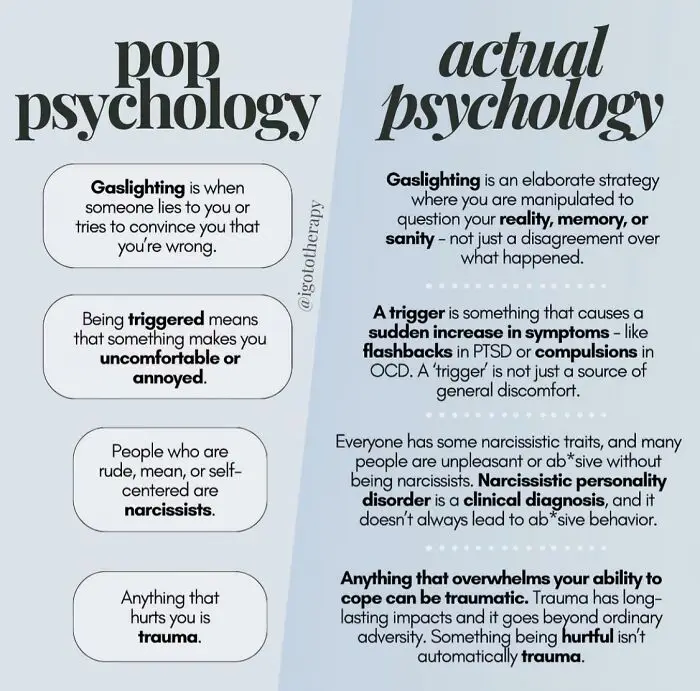
#1 A Cool Guide To Pop vs. Actual Psychology

Infographic comparing pop psychology and actual psychology concepts like gaslighting and trauma.
30points

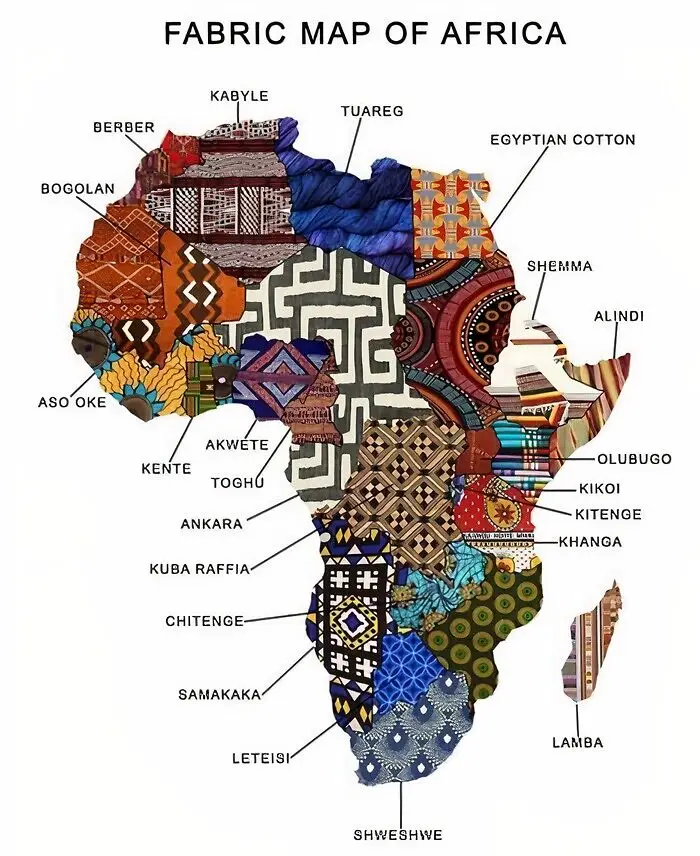
#2 Literal Art!

Fabric map of Africa showcasing various traditional textiles, highlighting brilliantly designed infographics for educational purposes.
21points

#3 A Cool Guide Equality, Equity, And Justice: Breaking It Down Differently
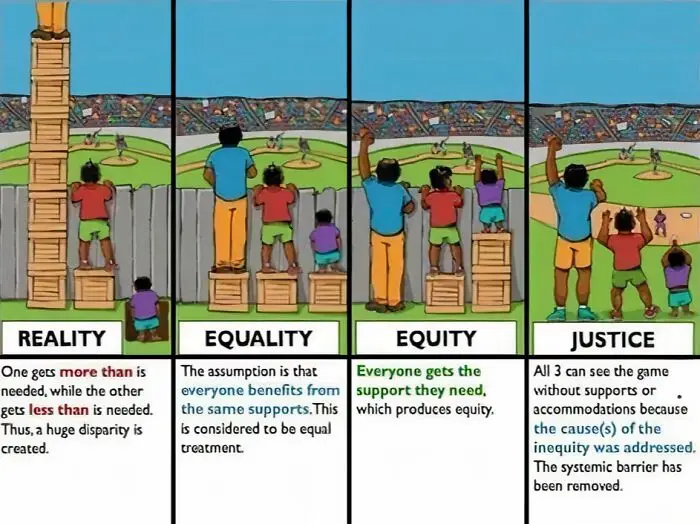
Infographic illustrating reality, equality, equity, and justice concepts with three people viewing a baseball game.
18points

#4 Hey Buddy

Venn diagram showing phrases used when starting a fight, petting a dog, or consoling a child.
16points

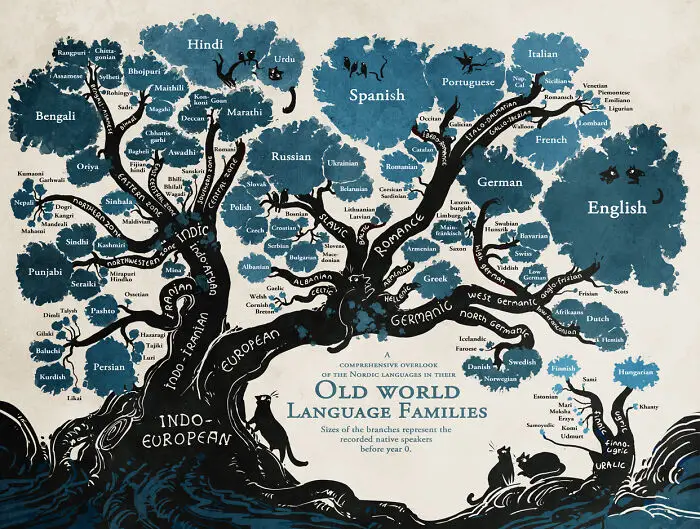
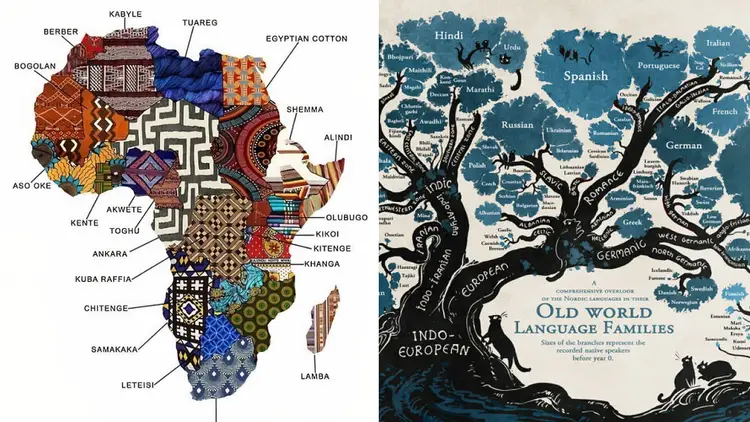
#5 Language Family Tree

Infographic illustrating the old world language families with a branching tree design.
16points

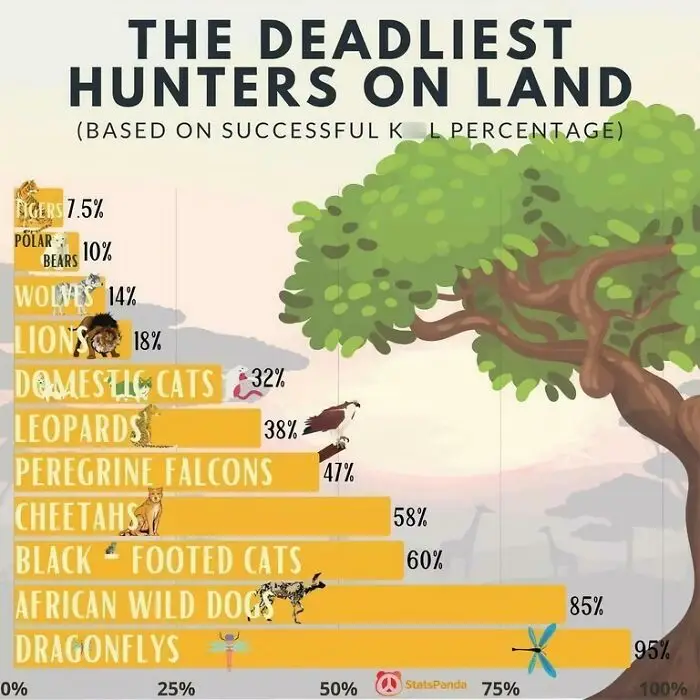
#6 The Deadliest Hunters On Land (Based On Successful Kill Percentage)

Infographic showing the deadliest land hunters by kill percentage, with dragonflies leading at 95%.
Report
15points

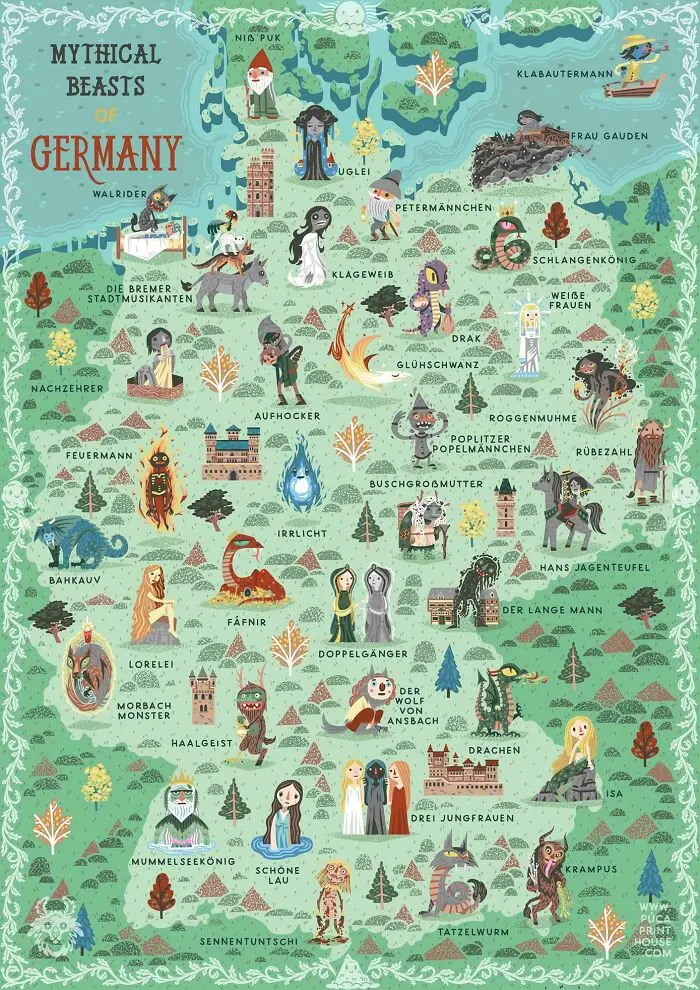
#7 A Cool Guide To The Mythical Beasts Of Germany [oc]

Infographic of mythical beasts in Germany, featuring various illustrated creatures on a detailed map.
14points

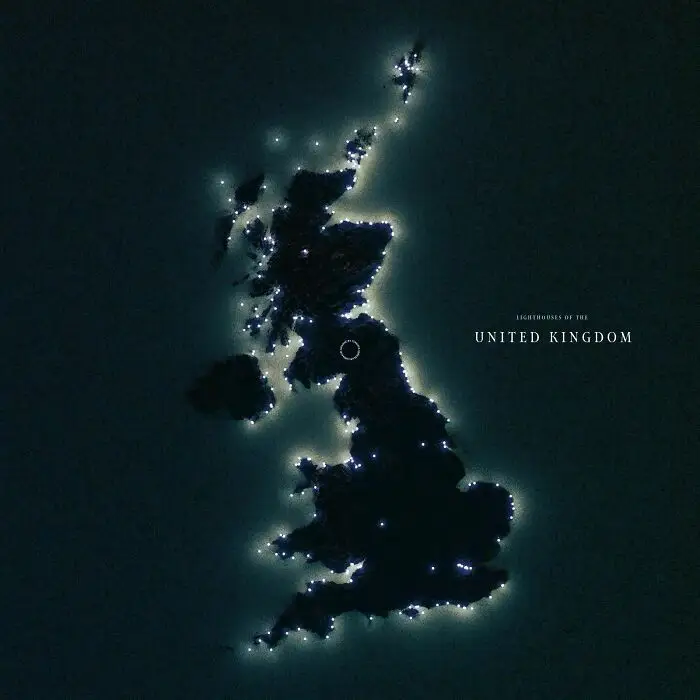
#8 A Cool Guide Showing The Lighthouses In The UK

Map of the United Kingdom showing the locations of lighthouses, part of brilliantly designed infographics.
13points

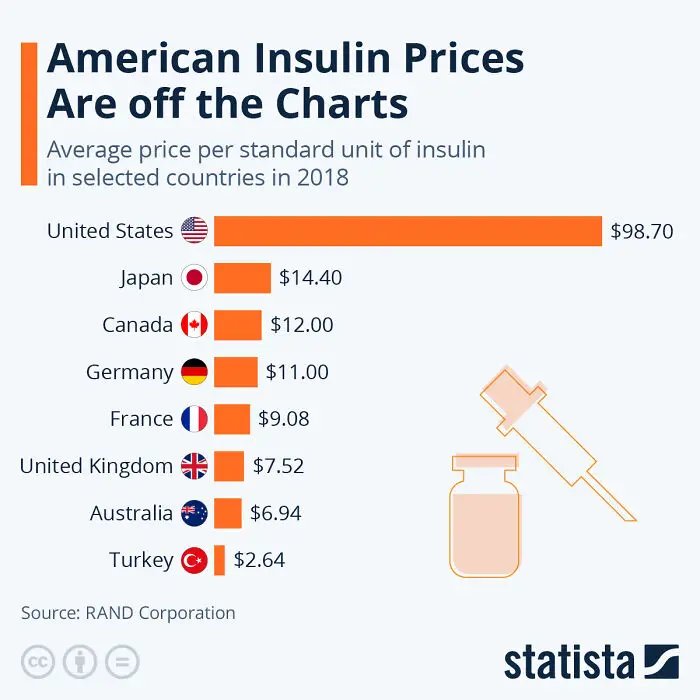
#9 American Insulin Prices Are Off The Charts

Infographic showing high American insulin prices compared to Japan, Canada, Germany, France, UK, Australia, and Turkey.
13points

#10 Evolution Of The Alphabet

Infographic illustrating the evolution of the alphabet from Proto-Sinaitic to modern Latin script.
12points

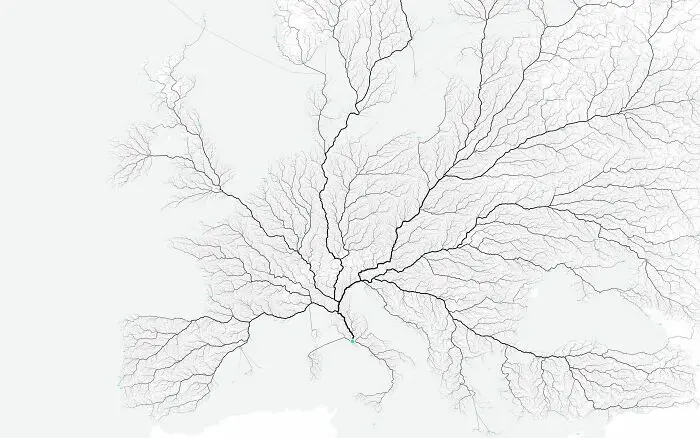
#11 European Roads To Rome

Intricate infographic design showing river networks forming a complex pattern for educational purposes.
Report
12points

#12 Venn Diagram Of Strippers/Cats

Venn diagram humorously comparing strippers and cats, illustrating a shared trait.
Report
11points

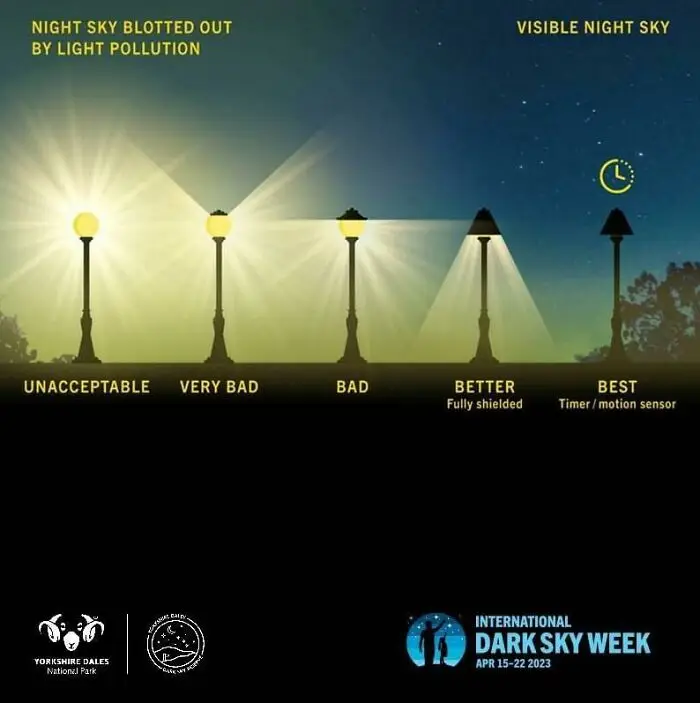
#13 Best Kind Of Street Lamps

Infographic on light pollution from street lamps, showing different levels from unacceptable to best shielding for dark skies.
Report
11points

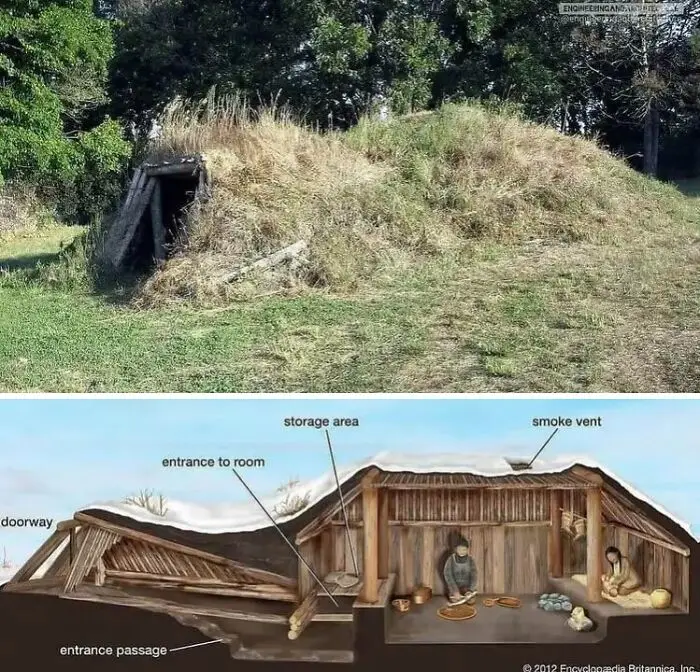
#14 A Cool Guide To Underground Aleut Homes (Barabara)

Underground dwelling infographics, showcasing a cutaway design and labeled features for educational purposes.
11points

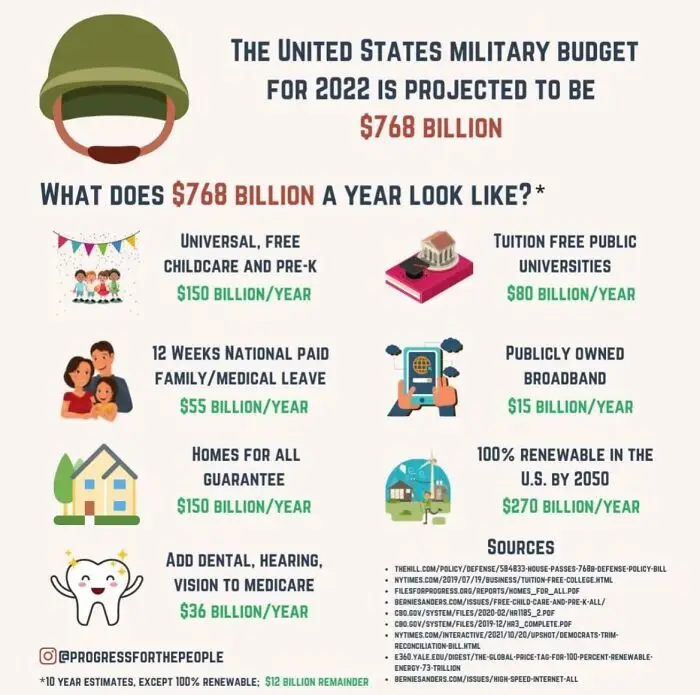
#15 We Could Fund Us…

Infographic on U.S. 2022 military budget allocation alternatives, highlighting potential spending on education and healthcare.
11points

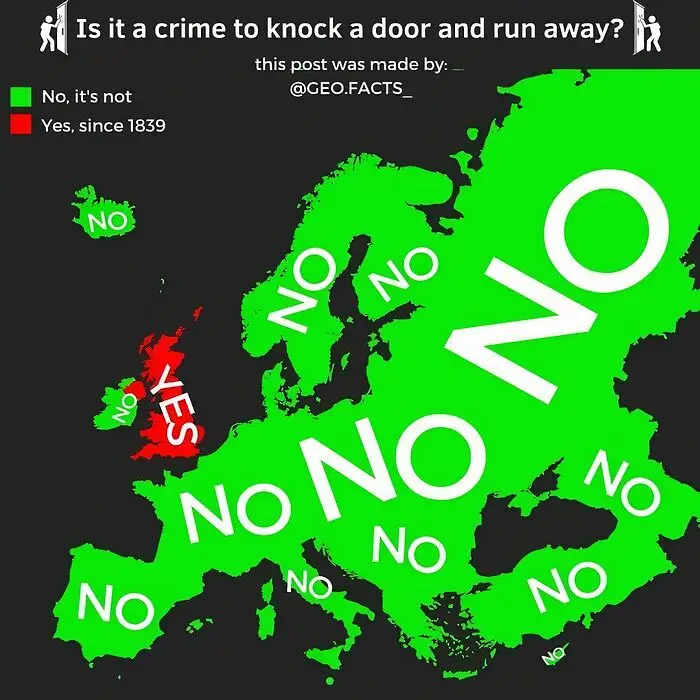
#16 Is It A Crime To Knock On A Door And Run Away?

Infographic showing if door-knocking and running is a crime in Europe; green is no, red is yes for Britain.
11points

#17 Friend: "You Can't Make Genetics Easy To Understand In Just One Image". Me:
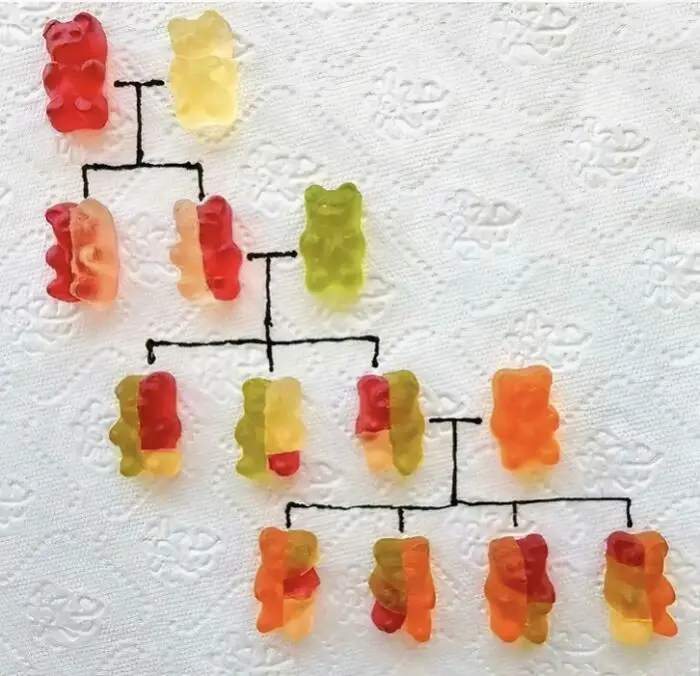
Infographic of gummy bears arranged in a family tree, teaching genetics concepts through candy visuals.
Report
10points

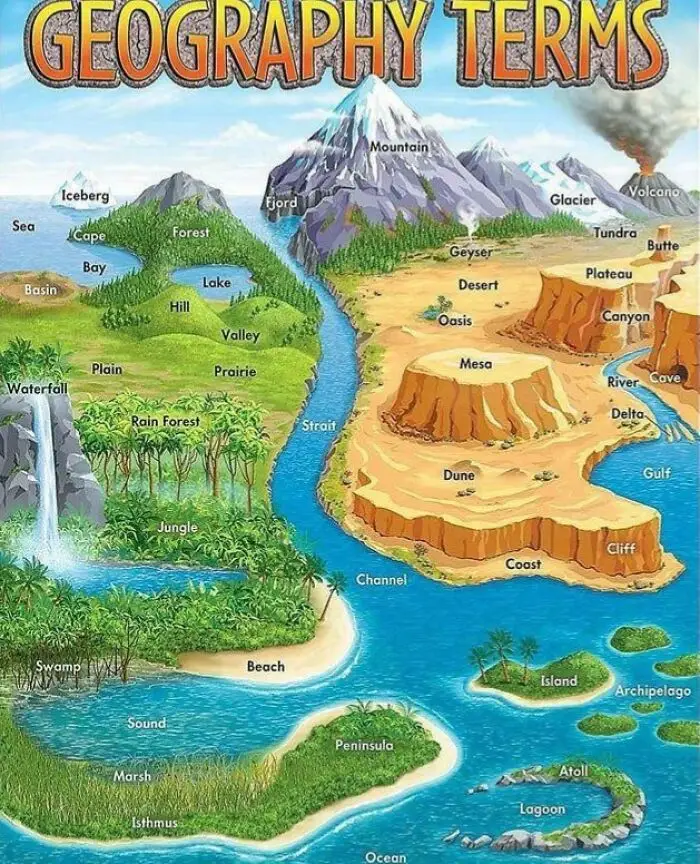
#18 Geography Terms

Illustrated geography terms infographic with landforms and features like mountains, deserts, rivers, and coastlines.
Report
10points

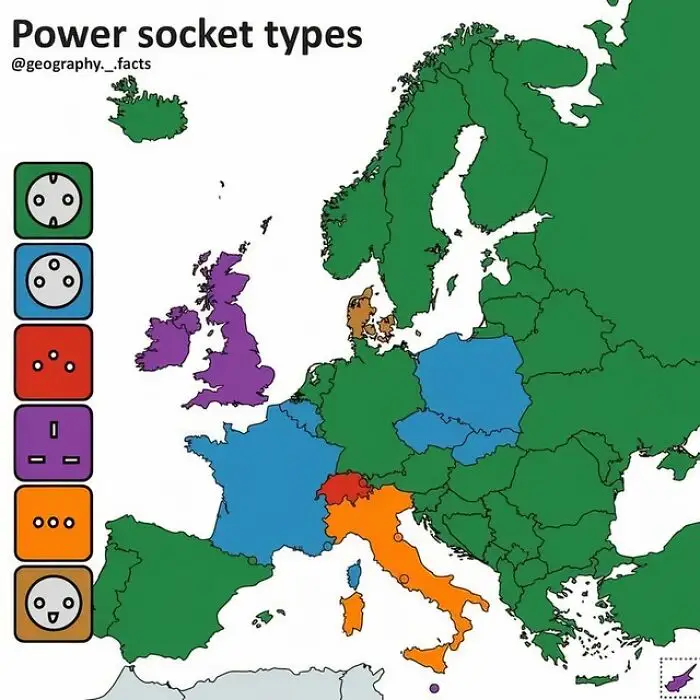
#19 Power Socket Type Guide

Infographic showing different power socket types across European countries with color-coded regions.
10points

#20 Places Where Birthright Citizenship Is Based On Land And Places Where It Is Based On Blood
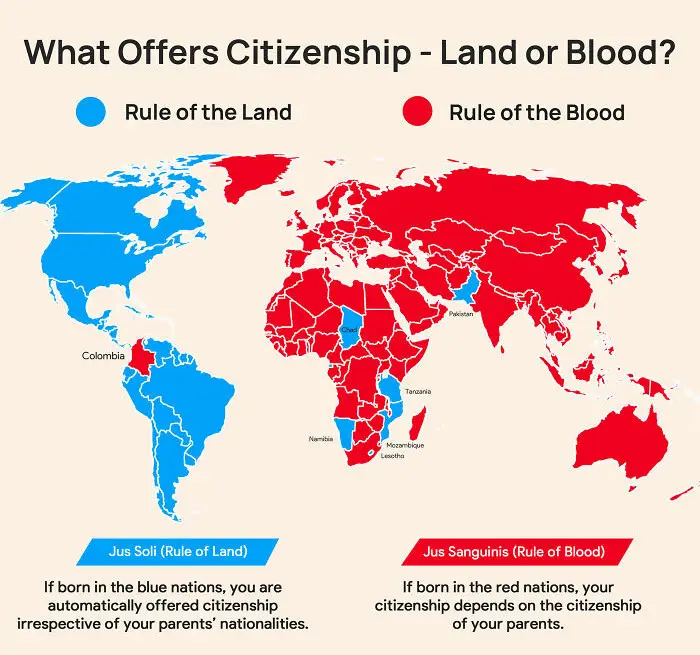
Infographic illustrating citizenship rules: land-based (blue) vs. blood-based (red) countries worldwide.
10points
23
3