




The moderators also noted that they work “above and beyond and really keep the community moving.” And as far as what’s popular in the community, there’s a wide variety of charts being shared. A couple of years ago, COVID posts had a massive spike, understandably, but today there are different trends. And when it comes to what type of graphs are ideal for the page, one moderator previously told Bored Panda, “Pies and bars certainly both have their uses, but we've all seen the results of tortured dataviz, and I think that's where something like the pie chart gets a bad rap.”
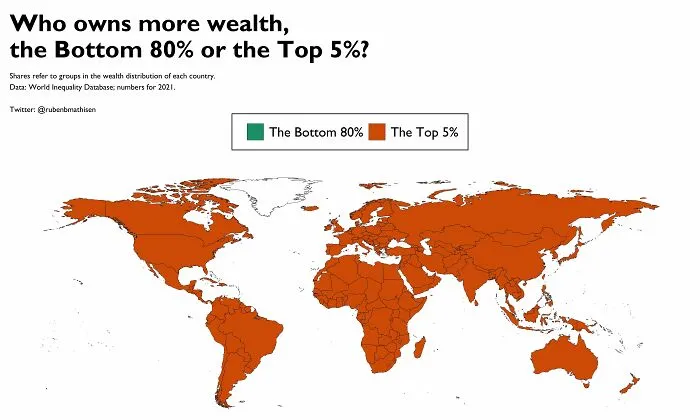
#23 Global Wealth Inequality In 2021 Visualized By Comparing The Bottom 80% With Increasingly Smaller Groups At The Top Of The Distribution
There are literally no limits to the kinds of information that can be displayed in a gorgeous graph or captivating chart. All you need to make your own is some reliable data, a computer program that can create a stunning display of information and a clear message to convey. Data is anything but boring, because it can be about anything you like! If you’re interested in food, politics, cultural differences around the world, or anything else, you can certainly learn something new in the Data is Beautiful group.
Are you feeling wowed by these gorgeous charts and displays of data? These pics just go to show that everything in life can be fascinating, even statistics, if displayed in the right way. Keep upvoting the charts you love the most, and let us know in the comments what information you’d like to see conveyed in a gorgeous way. Then, if you’re interested in checking out Bored Panda’s previous publications featuring the Data is Beautiful subreddit, you can find those right here and here!
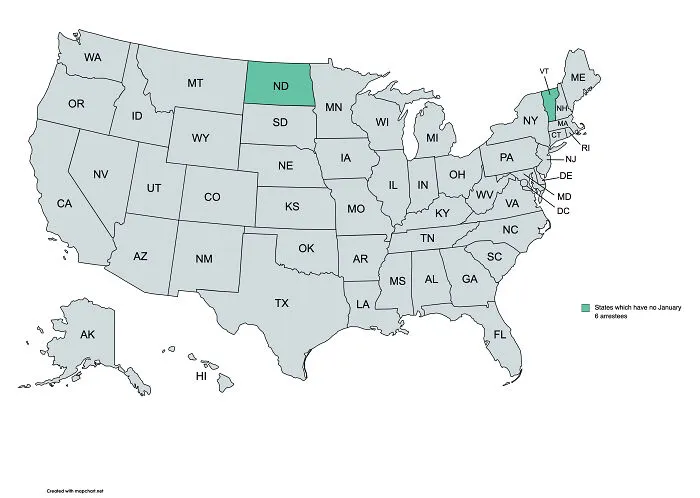
#29 Us States Which Do Not Have Residents Arrested For January 6 Offences
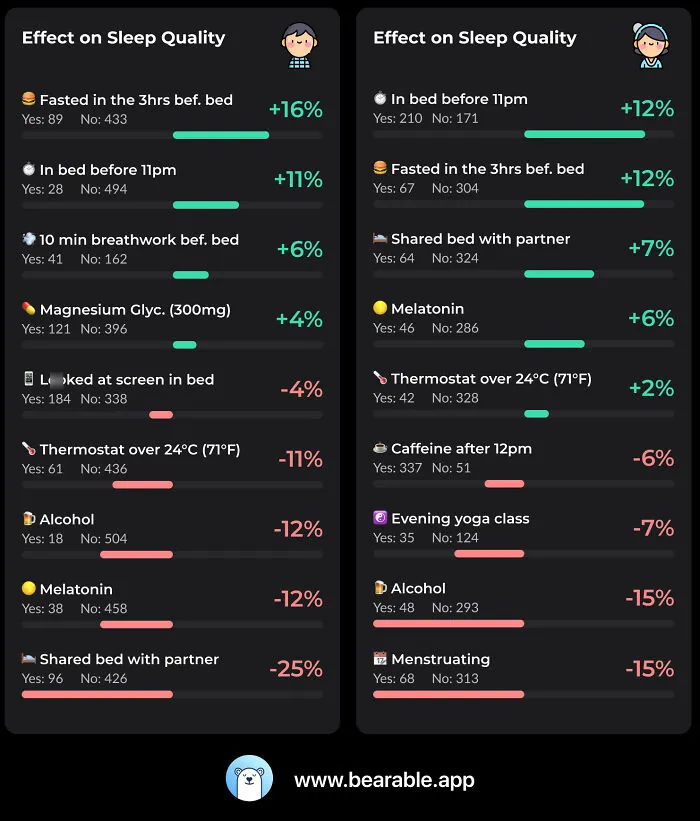
#30 2 Years Of My GF And I Tracking The Sleep Quality Impact Of Various Choices/Behaviours. These Were The 8 Most Significant Effects
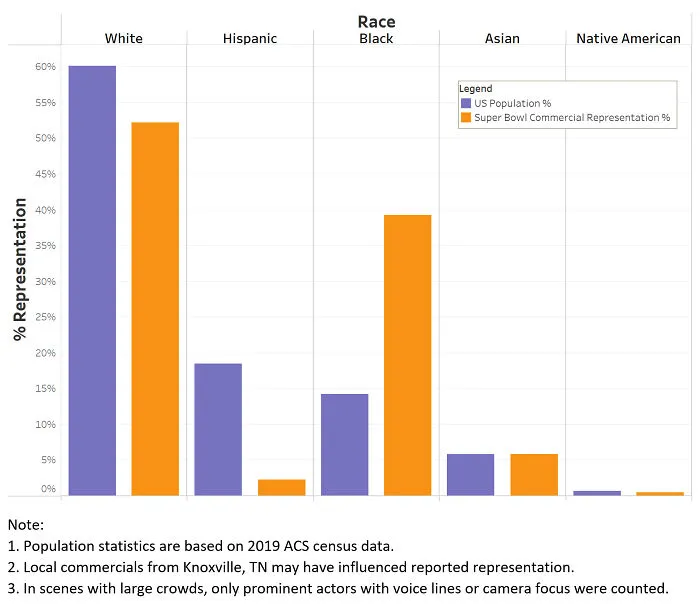
#38 I Recorded The Race Of All 433 Actors In The 2022 Super Bowl Commercials. Here's How They Compare To The Actual Us Population

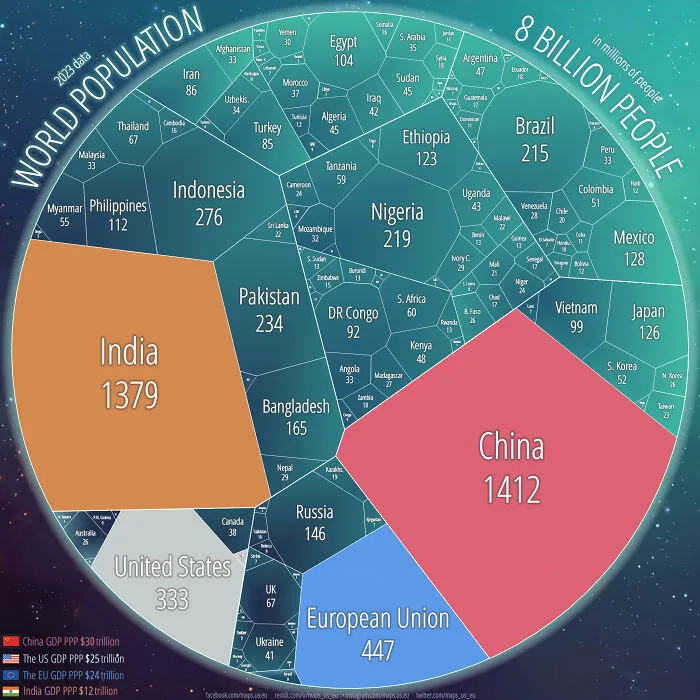
#40 World Population 2023 In A Single Chart Calculate In Millions Of People. China, India, The Us, And The Eu Combined Generate Half Of The World’s Gdp And Are Home To Almost Half Of The World’s Population