




It’s predicted that by 2025 we will reach 175 zettabytes of data created worldwide. For reference, one zettabyte stores as much information as 33 million human brains. Seeing such a figure, it can be hard to wrap around our heads just how much data is available to us, let alone be able to scratch its surface.
That’s why the creator of the Instagram account “We Have The Data” does their best to find and share data visualizations that present big amounts of information in an easy-to-understand and aesthetically pleasing way. Scroll down to find their best posts and make sure to upvote the ones that you find the most enlightening.
The largest data center in the world belongs to China Telecom Data Centre, in Hohhot. It occupies 10.7 million square feet, equivalent to about 180 football fields. When we say that we store information in the cloud, it’s not being stashed away somewhere in the atmosphere. It’s being kept in massive data centers—physical objects that actually take up quite a lot of space on our planet.


Since data generation is ever-growing, to meet the demand for storage, around 100 new data centers are built every two years. It’s estimated that if it continues to increase at the rate it is now, to sustain it, in 110 years we’ll need all the planetary power we consume today.
#25
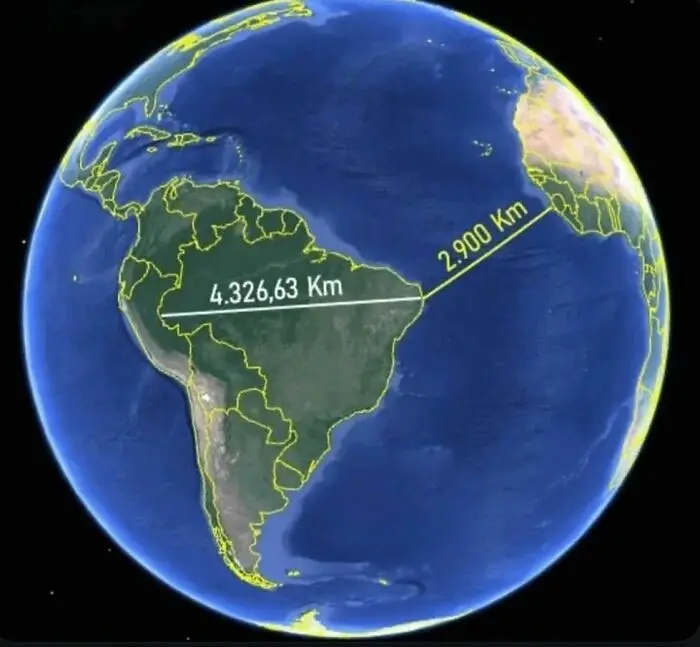
"The easternmost point of Brazil is closer to Africa than to its westernmost point"
Report
52points
#27
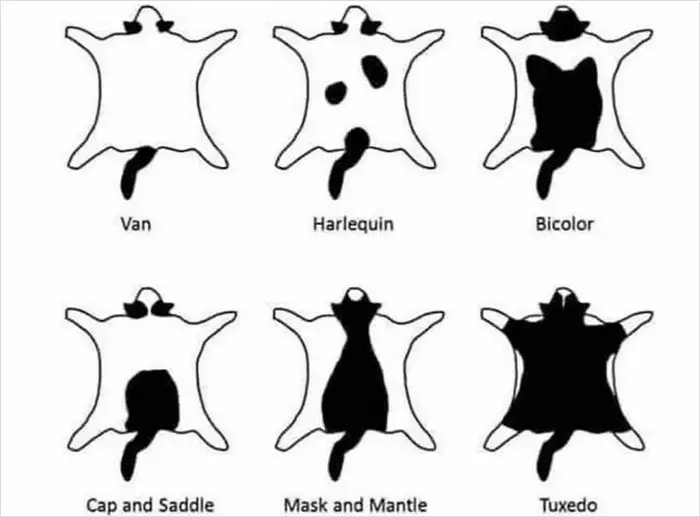
"A cool guide showing you the various patterns of black and white or tuxedo cats"
Report
48points