





The secret to any good visual representation of info, whether it’s an infographic, guide, brochure, poster, or the unholy unity of all of the above, is clarity. You want to find the golden balance between giving your audience all the information that they need without overwhelming them or losing their attention.
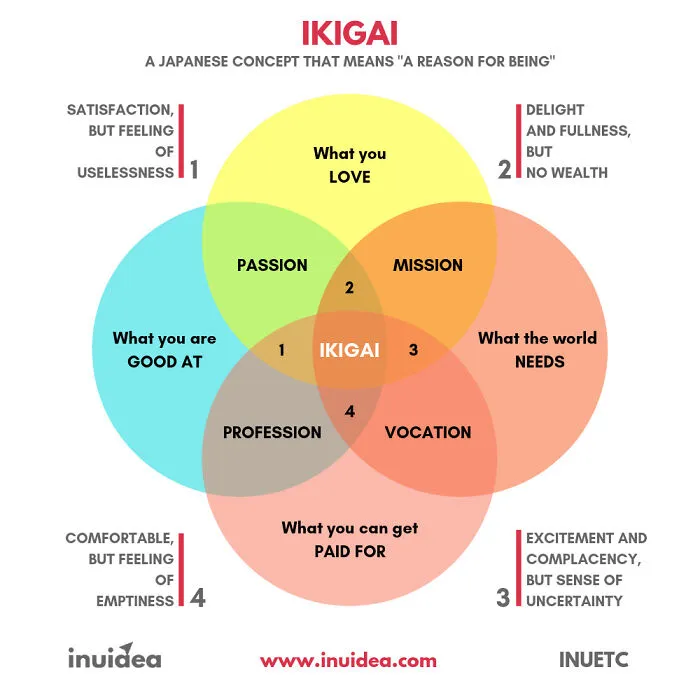
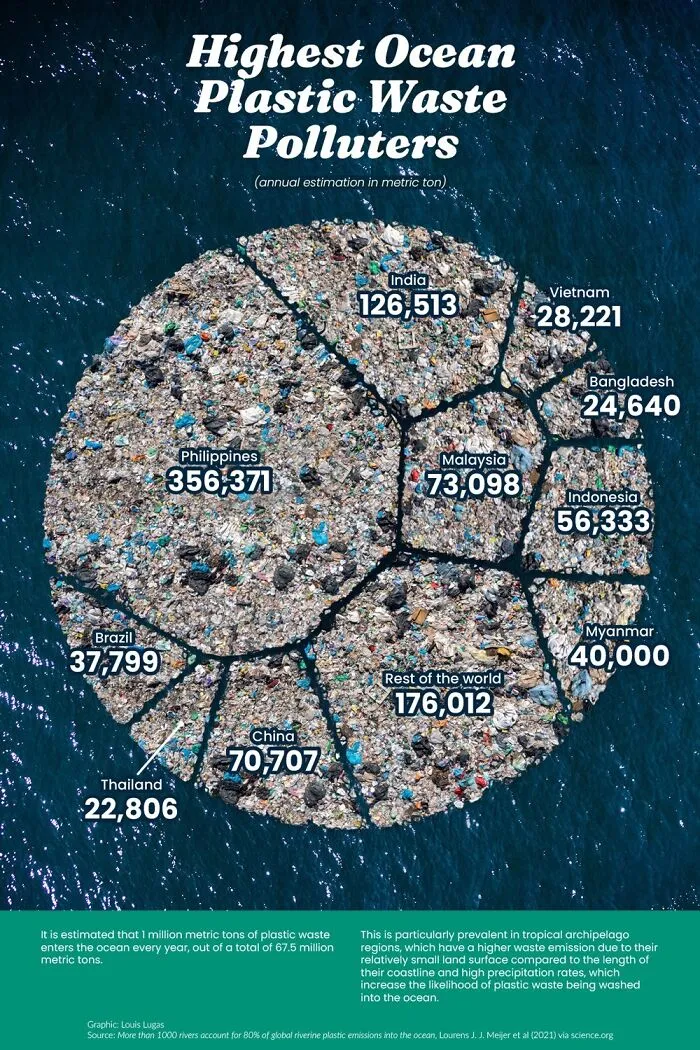
Your infographics have to be as brief as possible without losing important data, and that means using the visuals to reflect a part of that info in an intuitive, accessible manner. However, what seems clear to you might be confusing to the regular Joe or Jill on the street.

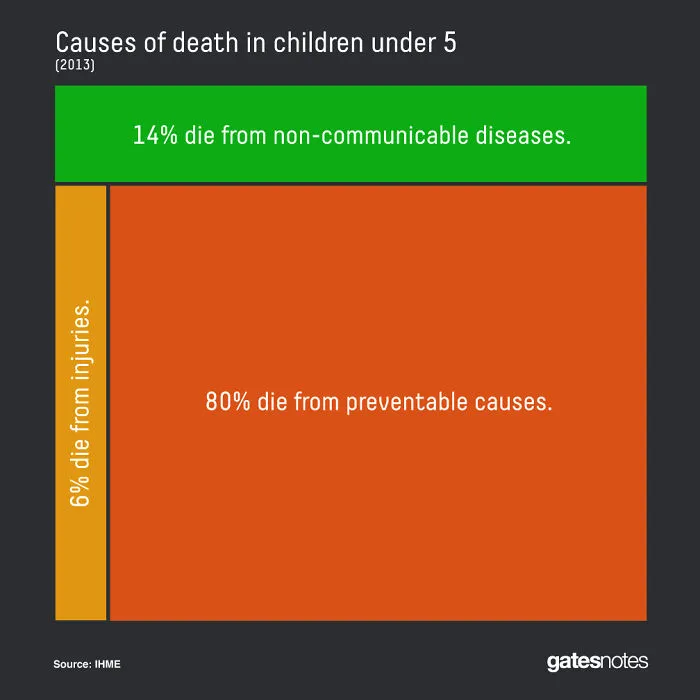
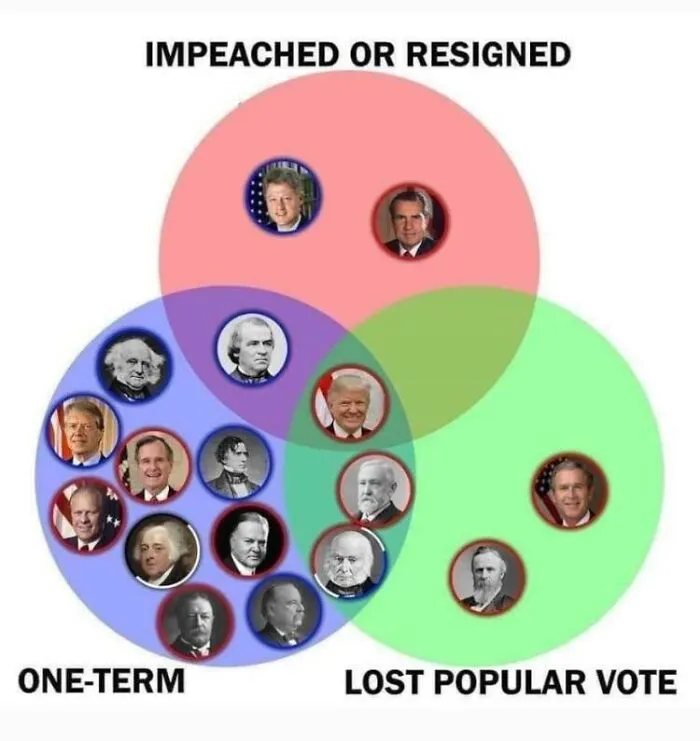
So before you go order a thousand printed copies of your infographic, show it to some people: your friends, your colleagues, your family parrot even. Get some honest feedback about what works and what doesn’t. Do some editing and proofreading. Don’t be afraid to go back to the drawing table! Though try to avoid the massive trap that is perfectionism, too. Aim for creating a great infographic, not a ‘perfect’ one.
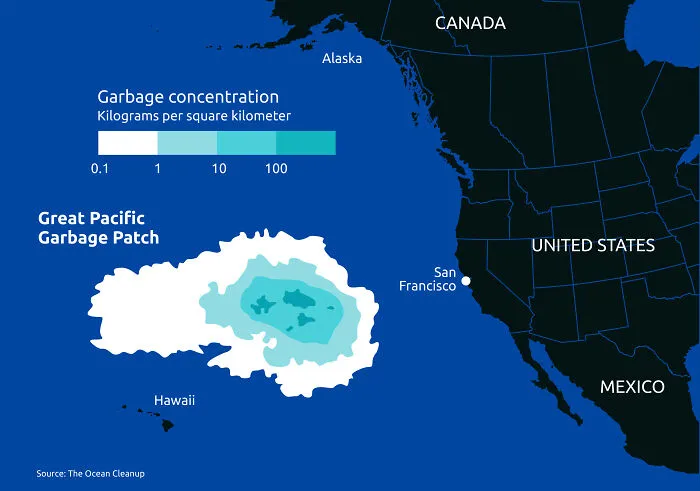
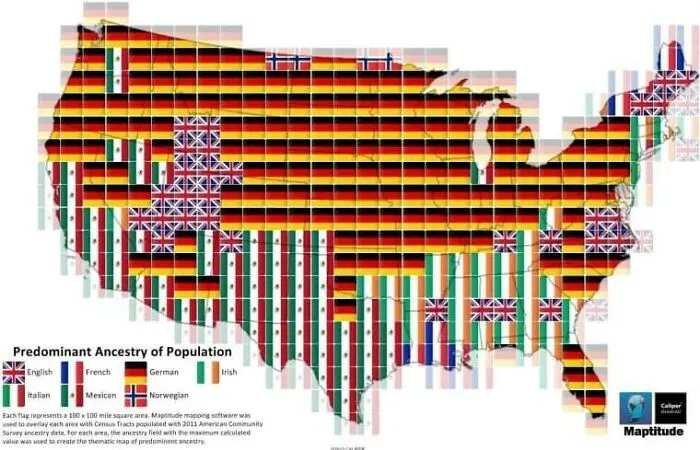
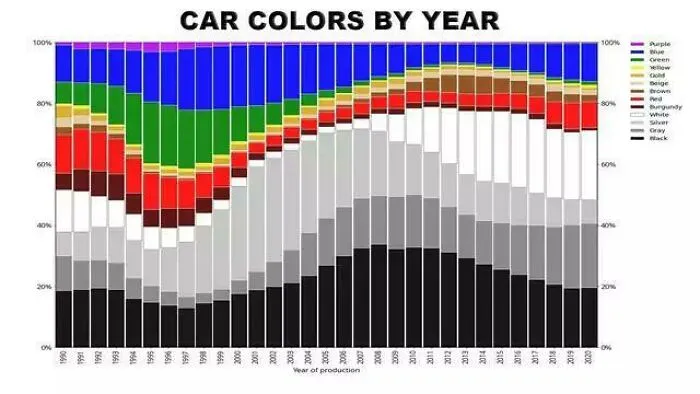
Which of these infographics did you find the most interesting and intriguing, dear Pandas? Which ones stood out to you the most from a purely visual perspective? What kinds of infographics would you love to see in the future? Share your thoughts in the comments.
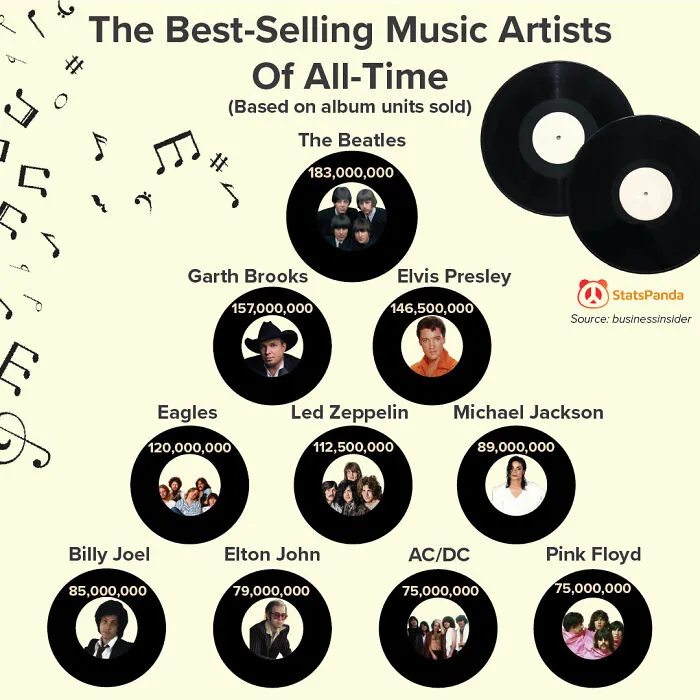

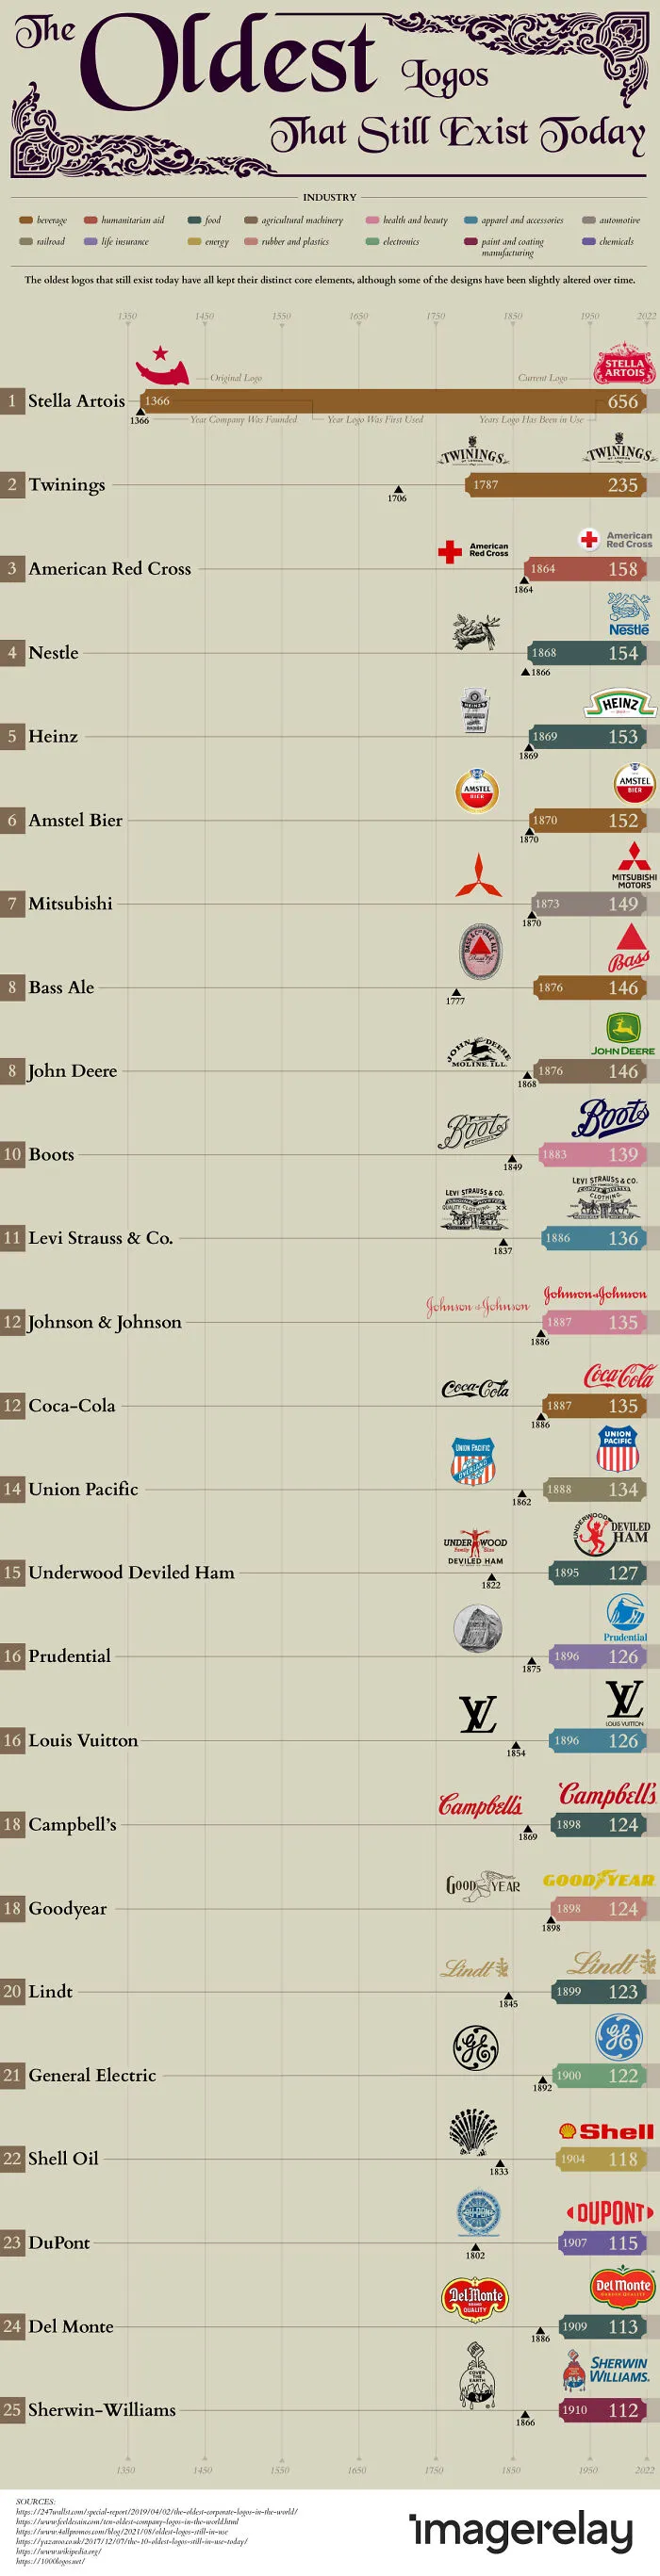
#36 The Oldest Logos That Are Still In Existence Today (Based On Distinct Core Elements Still Being Used)
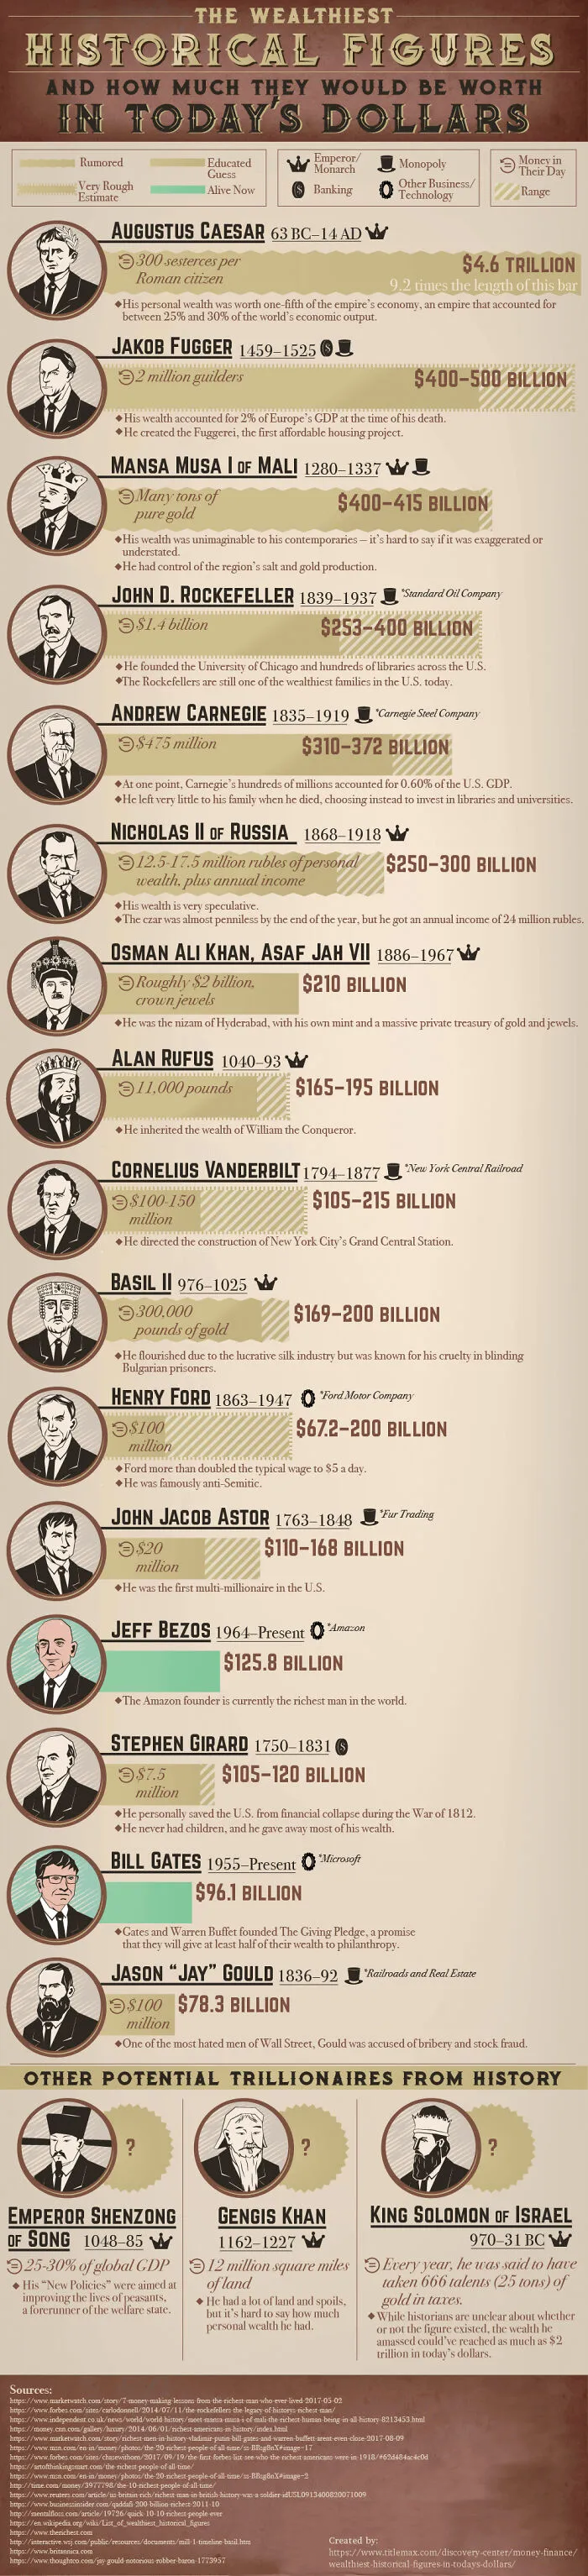
#38 The Wealthiest People Of History & What They Would Make In Today's Dollars