





Data analysts are a true gem in society. They gather data that’s available for all of us to see and compare. After all, humans are naturally curious, and we all love learning more and more about the world around us.
Like, which social media app is the most used around the world? What would the Netherlands look like if they hadn’t built dikes? Or what did Manhattan look like in the 1900s? Well, if these are all questions you never thought about but would love to know the answers to, we’ve compiled a list of some of the coolest and most interesting data maps for your inner nerd to appreciate.
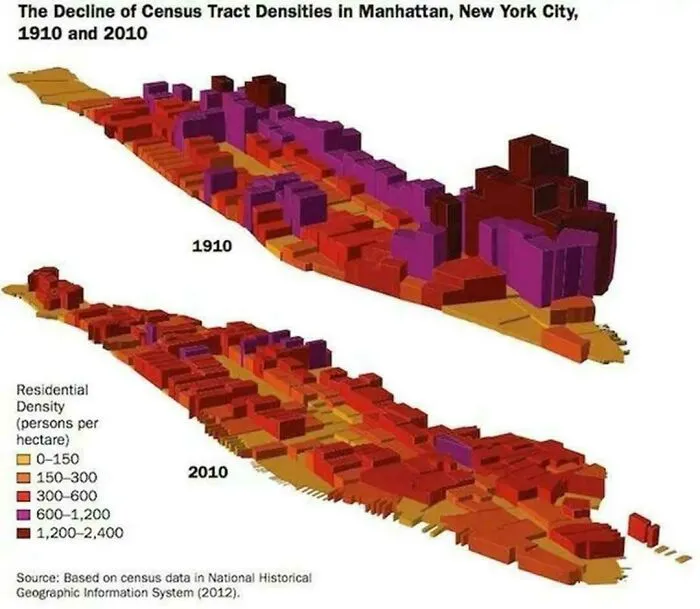
#41 Manhattan Today Has 600k Fewer People Living On It Than It Did In 1910
Report
7points
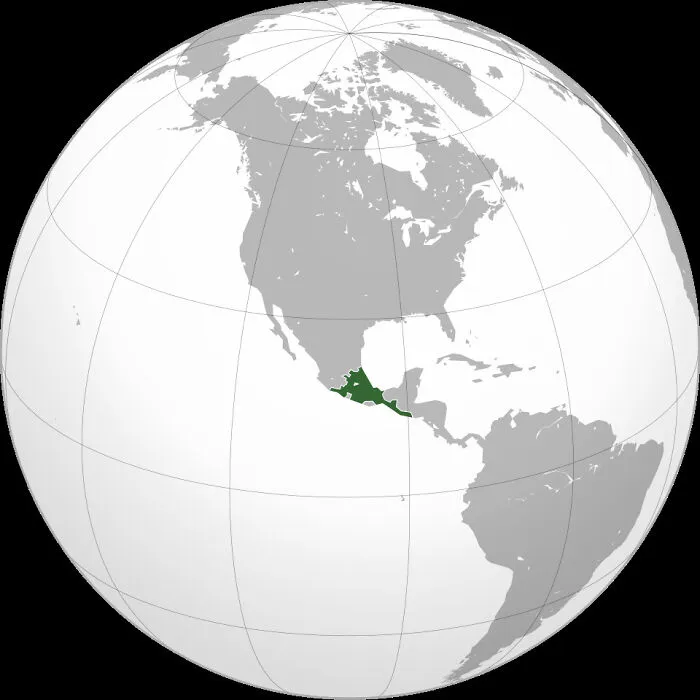
#44 Aztec Empire At Its Greatest Territorial Extent In The Early 16th Century
Report
7points


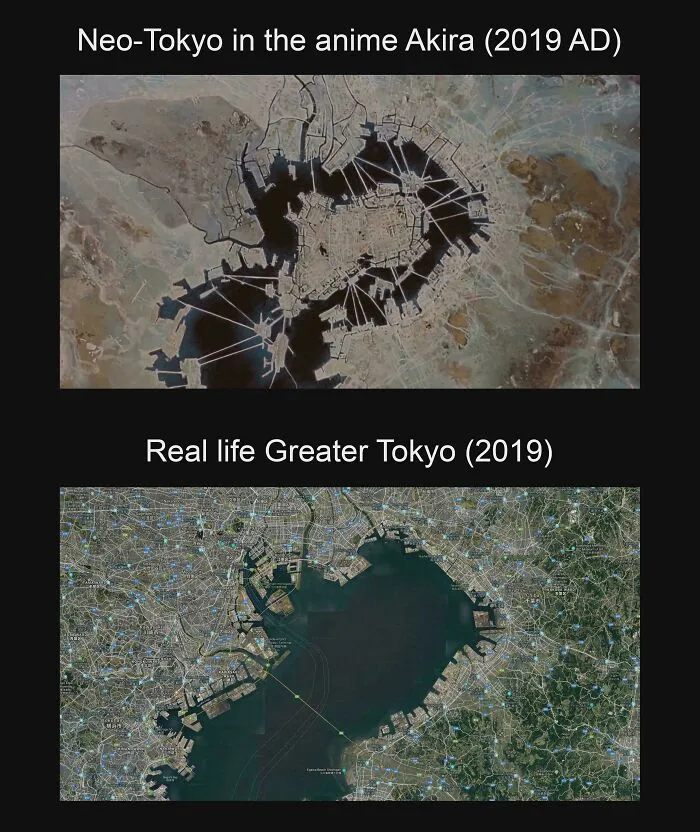
#50 Neo-Tokyo's Artificial Islands In Akira Compared To The Real Life Tokyo Bay
Report
5points
#54 Percentage Of Population Proud Of Their Colonial History In Selected Countries In Europe
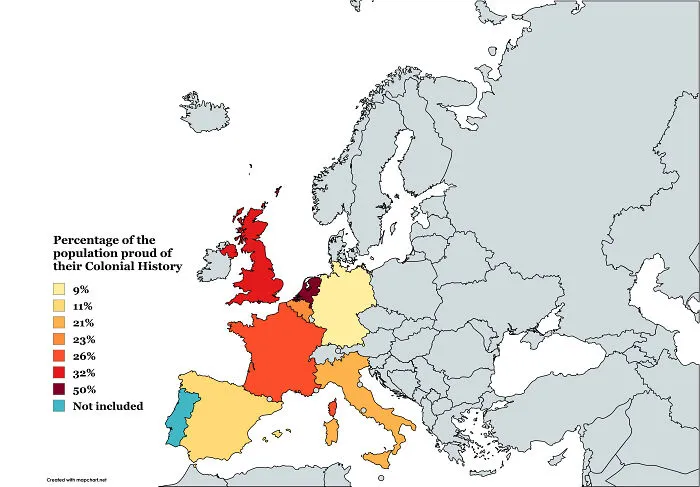
Report
5points