







Over 65% of the population are visual learners, so catering to them is crucial and also contributes to the success of your presentation. An additional tip that appeases visual learners is highlighting what is called an ‘Aha!’ zone—a number or piece of information that is essential to the point you are trying to make. Explaining it out loud and writing it, and highlighting it in your chart helps to reinforce the most important data takeaways.



Lastly, experts advise presenting to your audience, not your data. People best receive the point you’re trying to make when you’re looking at them. Make critical points to your audience and only occasionally glance at your slides and data.
“When presented clearly and pointedly, data can elevate your point’s credibility and trustworthiness,” Harvard Business Review writes. “Presenting data poorly not only squanders that opportunity but can damage your reputation as a presenter. It’s a powerful t**l to draw out compelling truths—wield it wisely.”

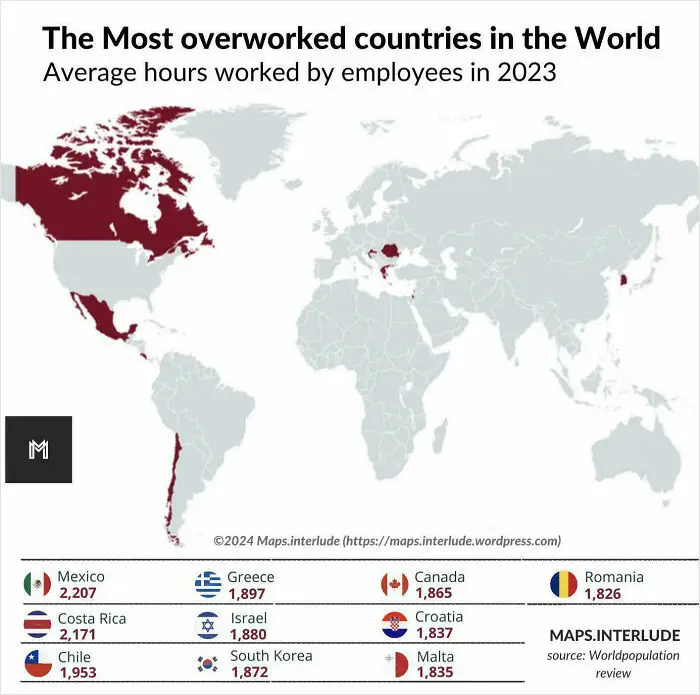

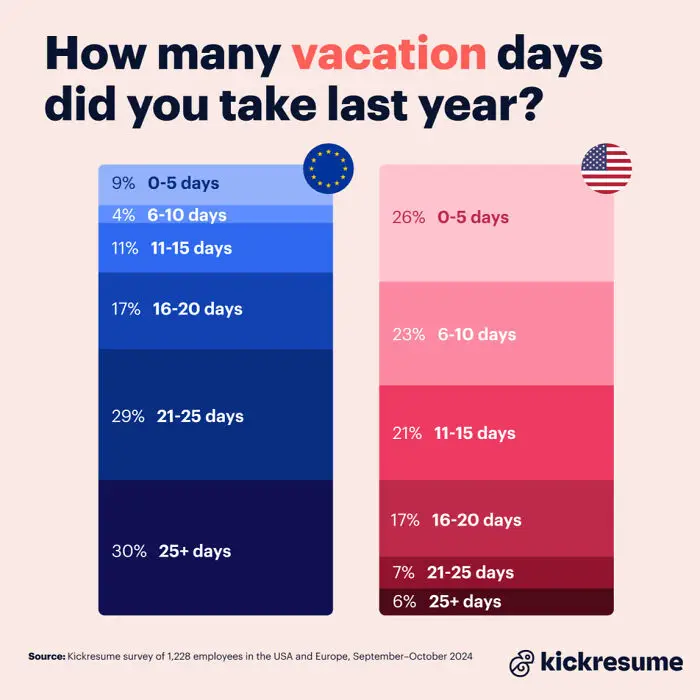
#30 USA vs. Europe Work Culture: Nearly 30% Of Europeans Took More Than 25 Vacation Days, While Only 6% Of Americans Took That Much Time Off According To A Survey Of 1,228 Employees


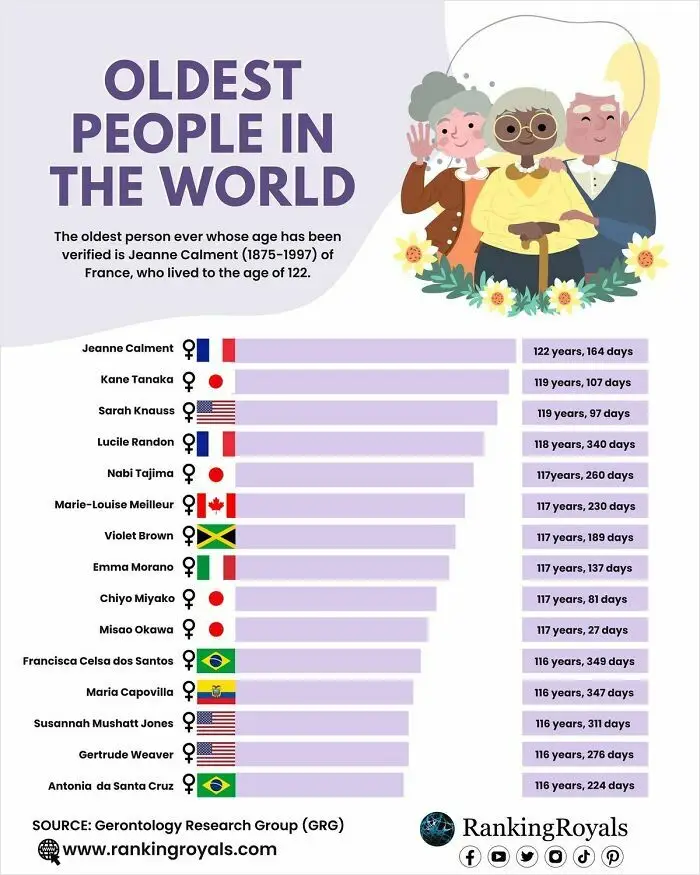
#33 The World’s Oldest Individuals Are Those Who Have Lived The Longest Verified Lifespans