

Bored Panda
30 Charts That No One Probably Needed, But Here They Are Anyway
CuriositiesFEB 25, 2025

30 Charts That No One Probably Needed, But Here They Are Anyway

70
8
Who doesn’t love a good visual breakdown of data, neatly packaged for easy consumption? I’m talking rows, bars, tables, graphs, maps—the works. 2D, 3D, black and white, color-coded, all beautifully laid out for maximum clarity.
That’s exactly what you’ll find on r/charts—a subreddit dedicated to, well, charts. From serious and insightful to glaringly obvious and hilariously unnecessary, this place has it all. We’ve rounded up some of the best ones below. Enjoy!
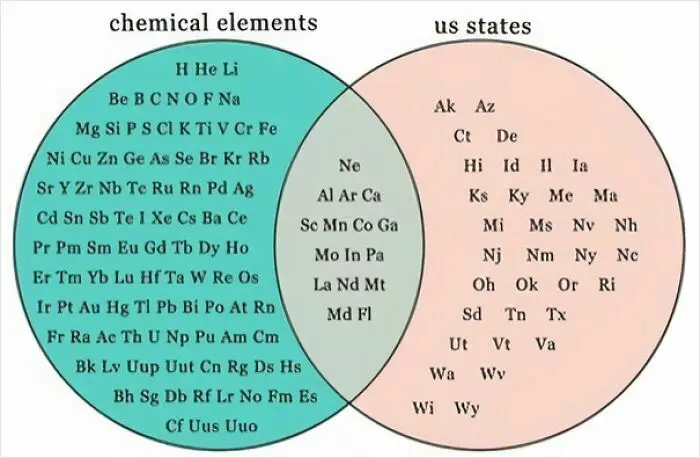
#21 Venn Diagram Of States And Elements

Venn diagram of interesting charts comparing chemical elements and US states using abbreviations.
Report
30points

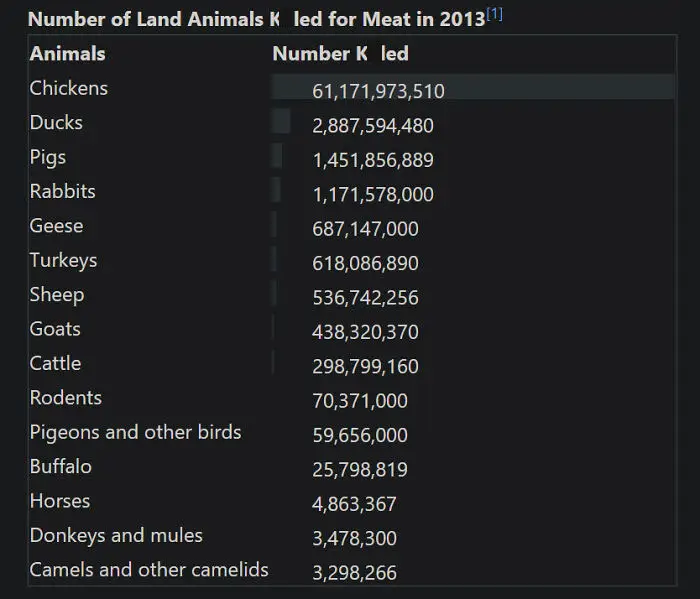
#22 Number Of Land Animals K**led For Meat In 2013

Chart showing numbers of various land animals killed for meat in 2013, highlighting chickens with over 61 billion.
28points

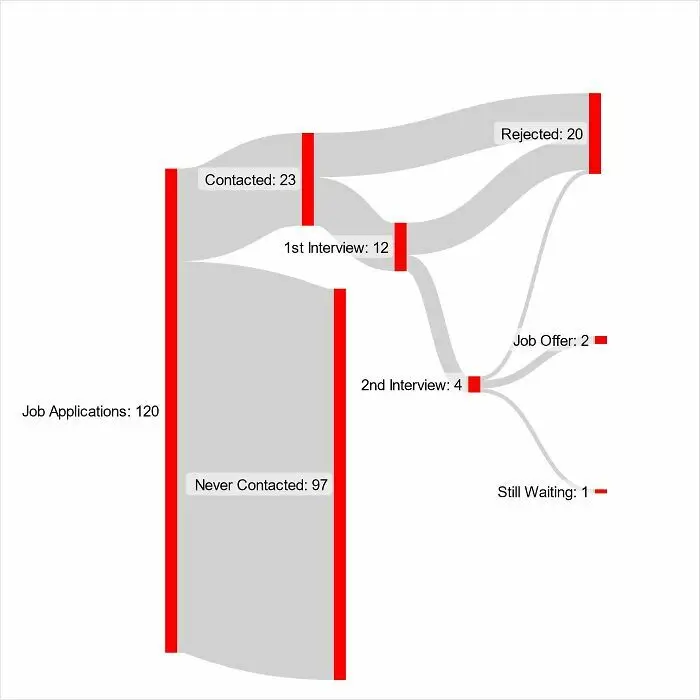
#23 5 Months Of Job Searching While Working Part Time

Flowchart of job application outcomes: contacted, interviews, rejected, offers, highlighting world trends in an interesting way.
27points

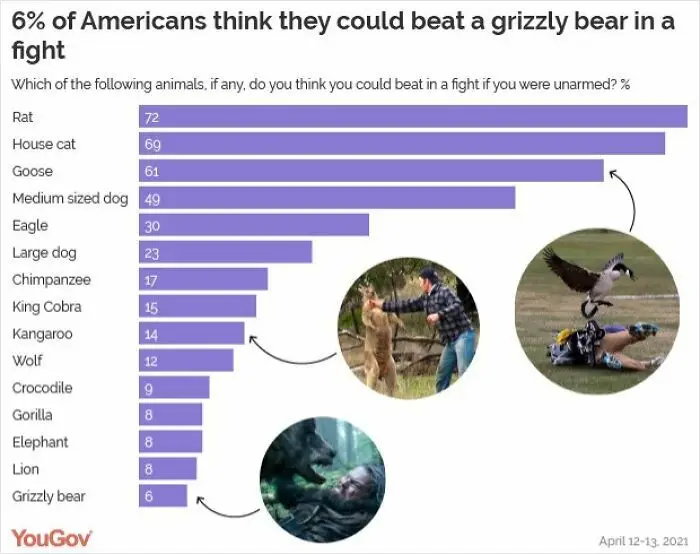
#24 Which Animals Do Americans Think They Could Beat In A Fight?

Chart showing survey results on which animals Americans think they could beat in a fight, highlighting fun global perspectives.
27points

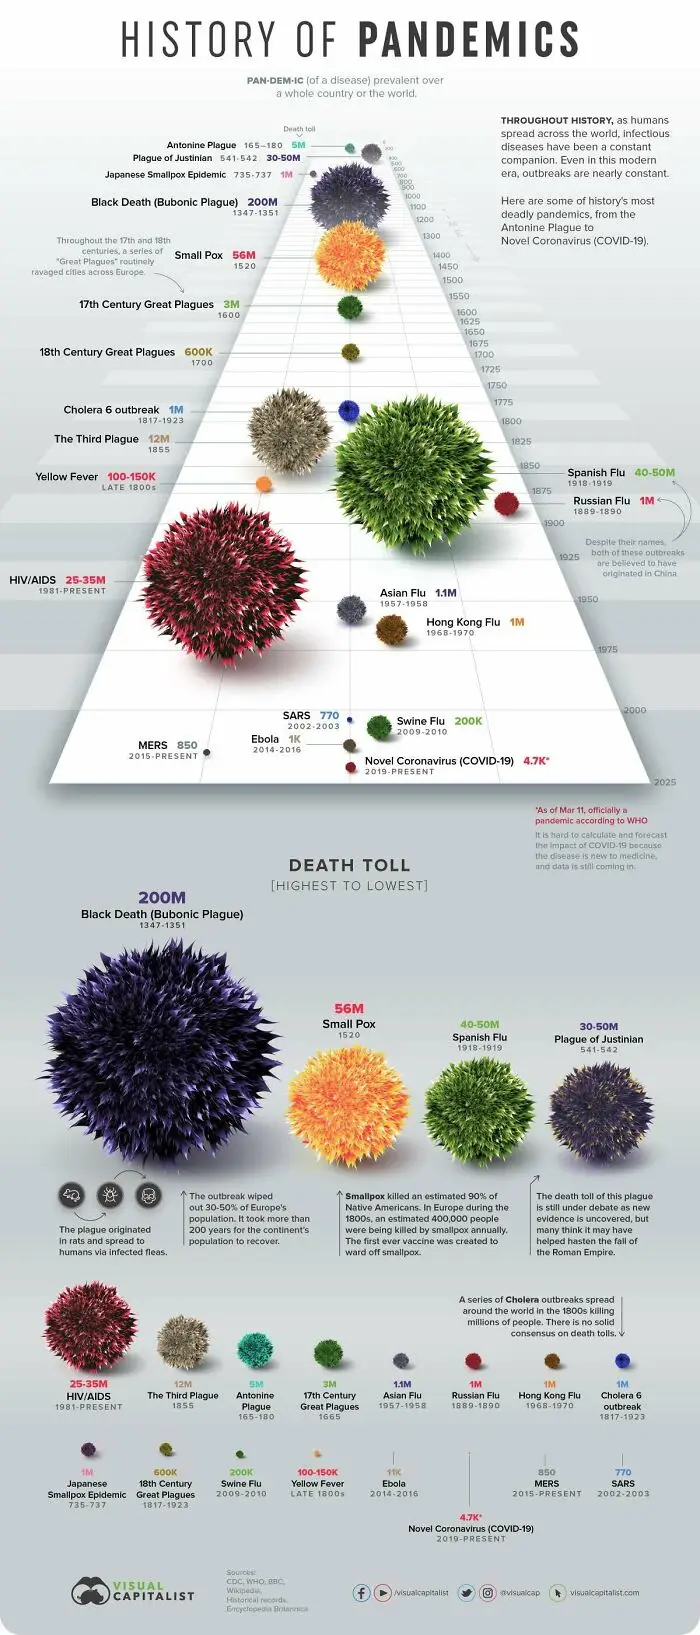
#25 History Of Pandemics

Chart showing world pandemics by death toll, including Black Death, Smallpox, and COVID-19, in a fun visual style.
26points

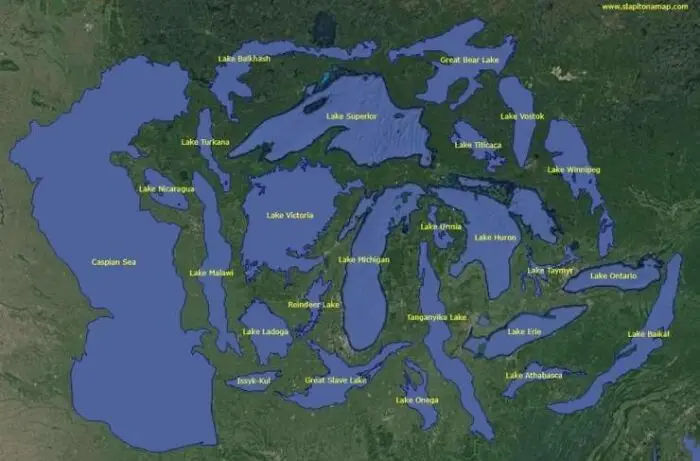
#26 World’s 25 Largest Lakes Side By Side

Map showing interesting charts of the world's largest lakes labeled on a green landscape background.
Report
25points

#27 Fun With Data. If You Make A Graph With Log Scale Of Covid Cases In Belgium And UK, You Get This Piggy
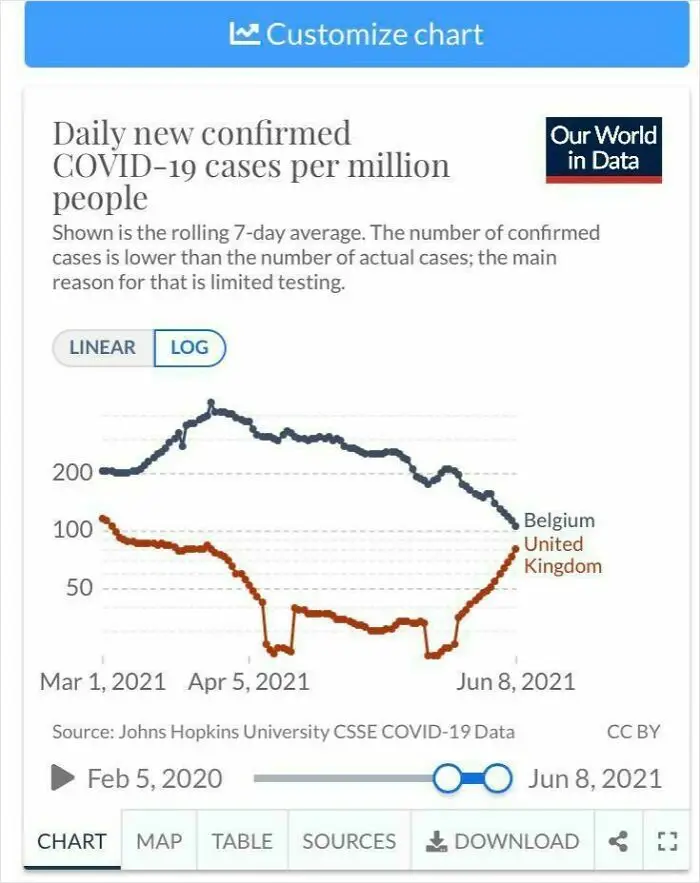
Chart showing daily COVID-19 cases per million in Belgium and UK from March to June 2021.
Report
25points

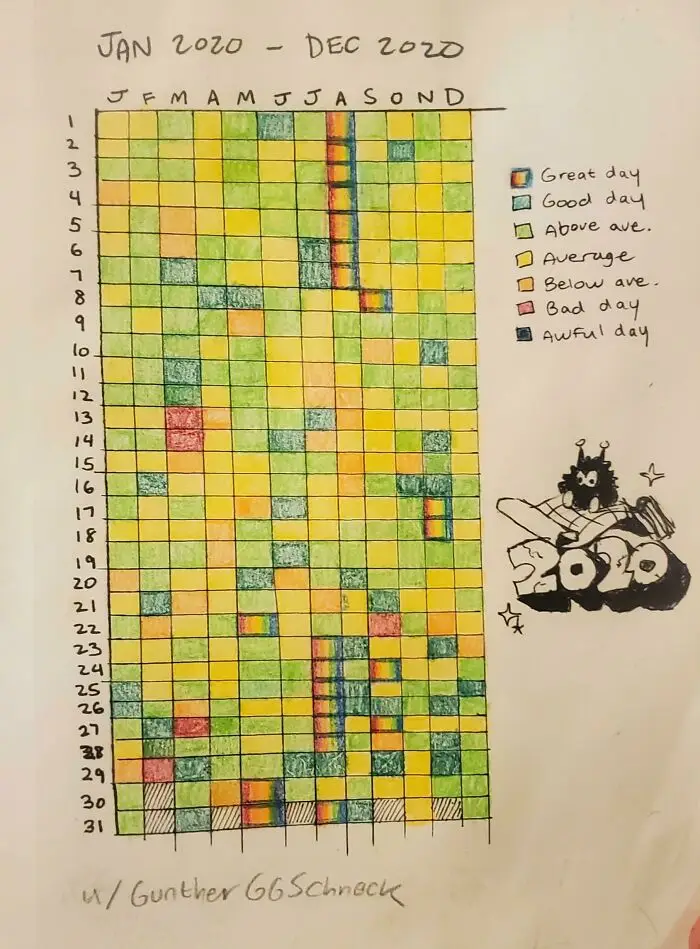
#28 I Cataloged 2020 By The Quality Of Each Day

Color-coded chart of 2020 tracking daily moods from great to awful, illustrating the year's events in a fun way.
23points

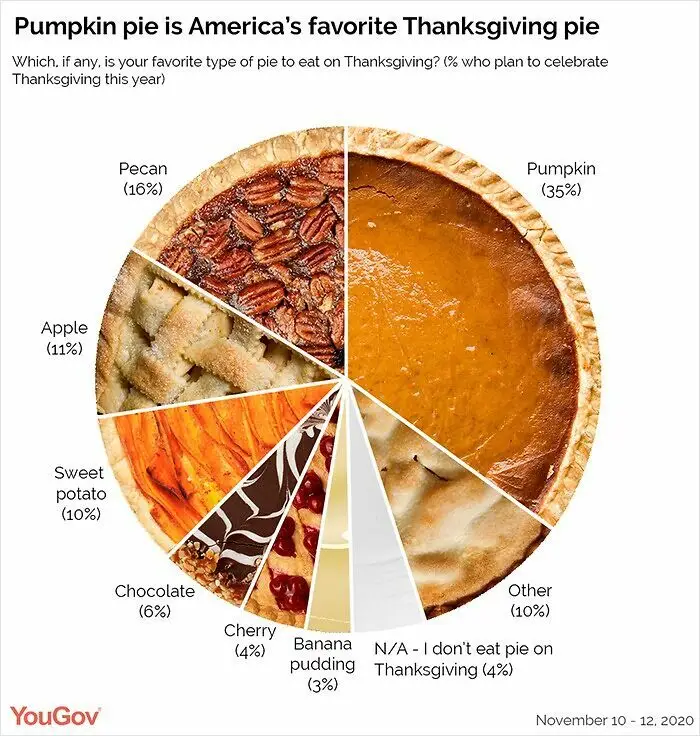
#29 America's Favorite Thanksgiving Pie!

Pie chart showing America's favorite Thanksgiving pies, highlighting pumpkin pie as the top choice at 35%.
20points

#30 I Posted On R/Polls: Should Making Racist Comments Be Illegal? Here's The Breakdown Of Over 4,000 Responses
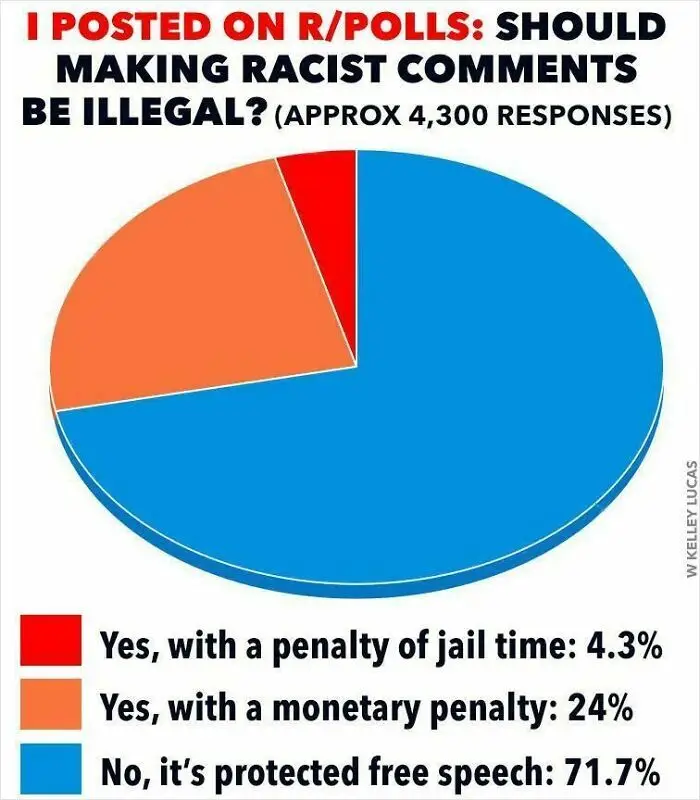
Pie chart showing opinions on legality of racist comments. Majority (71.7%) view it as protected free speech.
18points
70
8