



“Most of our discussions back then focused on critiques and improvements of the data visualizations themselves, a focus that still sits at the core of the community to this day,” the moderator shared what the start of the community was like.
“In February 2012, the Reddit admins and DIB mods agreed to make /r/DataIsBeautiful a default subreddit. That meant that every new Reddit user would automatically be subscribed to DIB and our top content would consistently show up on the Reddit front page. After that point, our community grew extremely fast and continued growing even when the default subreddits were abolished in mid-2017,” they shared one of the reasons why the sub grew as fast and as big as it did.
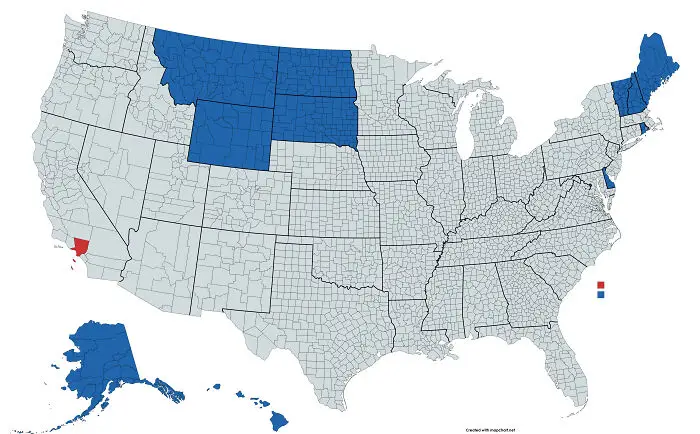
#24 The States In Blue Have A Combined Total Population Equal To Los Angeles County, In Red
It really isn’t just about the pretty pictures, however. Anyone who wants to dig a little deeper and learn a bit more about how to visualize data well can do so. “We provide a handful of guides for folks just learning to create data visualizations, and we require every original content post to include at least a brief description of the data source and how the data visualization was created so folks can learn from that. DIB is a great place to learn the craft of data visualization by doing,” the moderator shared with Bored Panda.
#25 2020 Electoral Map If Only ____ Voted. Breakdown By Each Major Demographics

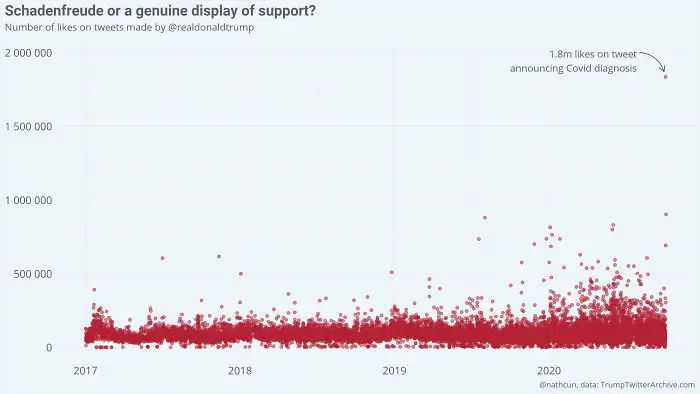
#26 Donald Trump's Tweet Announcing His Covid-19 Diagnosis Is, By Far, His Most Liked Tweet Since Becoming Us President
“DataIsBeautiful is for visualizations that effectively convey information. Aesthetics are an important part of information visualization, but pretty pictures are not the sole aim of this subreddit,” the subreddit explains what it’s all about.
Now, pretty graphs might not be the entire story, but they can sure help express data in a way that grabs (and holds!) your attention, so you can understand the data better. Something that’s clear and stunning will help you remember it better. And if you understand something well, you can then use that data in arguments and (socially distanced) dinner parties.
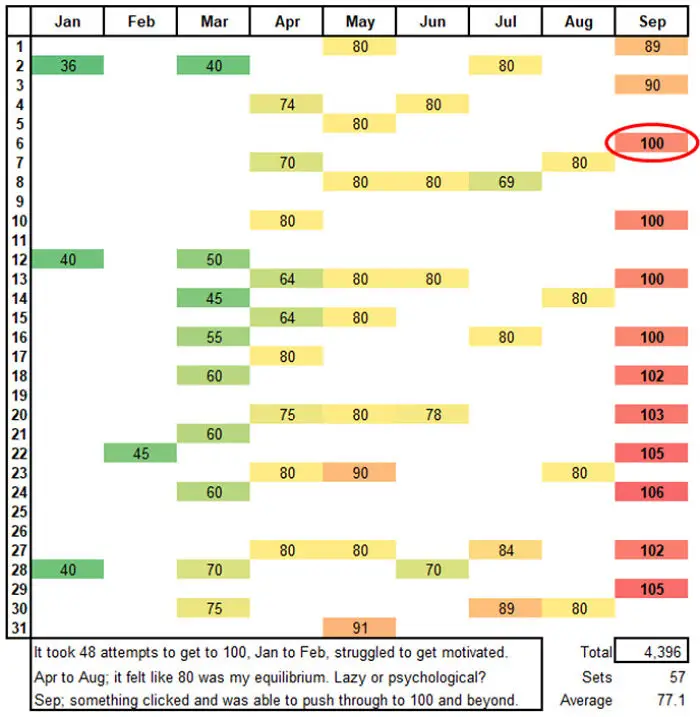
#28 Tracking My Push-UPS In 2020. My New Year’s Resolution, Was To Do 100 Push-UPS In One Go. It Was A Slow Burn, Took Over 8 Months And 48 Attempts To Build Up My Strength And Stamina (Age 49)
As a whole, the community very much appreciates originality and creativity. They encourage people to post their own original content (it’s got that little OC sign next to in case you want to see what’s what). If there’s a graph that you love in particular, send the creator a warm ‘thank you’ to encourage them to keep on creating data eye-candy. And if you end up sharing it somewhere, be sure to credit it properly. It’s original content, after all!
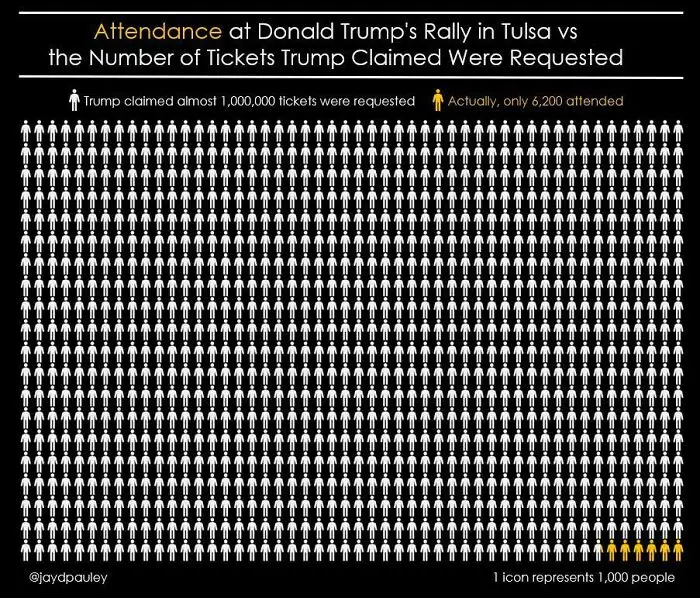
#30 Attendance At Donald Trump’s Rally In Tulsa, Compared To The Number Of Tickets Trump Claimed Were Requested
So, dear Pandas, which chart or graph did you enjoy the most? Do you think that good data will always speak for itself or do we have to give it a gentle nudge to make it more palatable for our eyes and minds? Do you draw maps in your spare time just like I do? And, we’ve got to ask—do you prefer pie charts or bar graphs, dear Readers? Leave us a comment below!
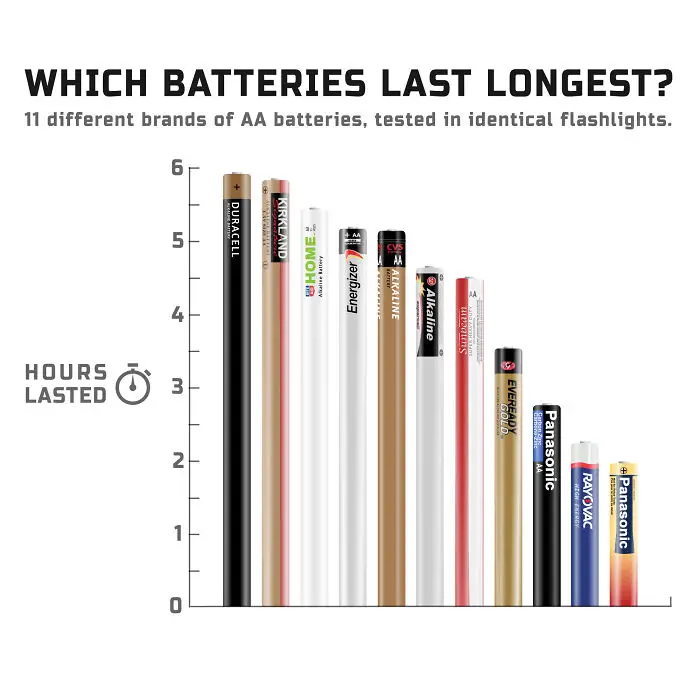
#32 11 Different Brands Of Aa Batteries, Tested In Identical Flashlights
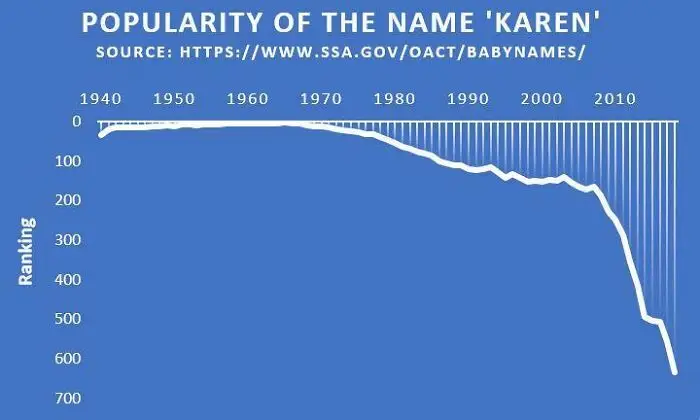
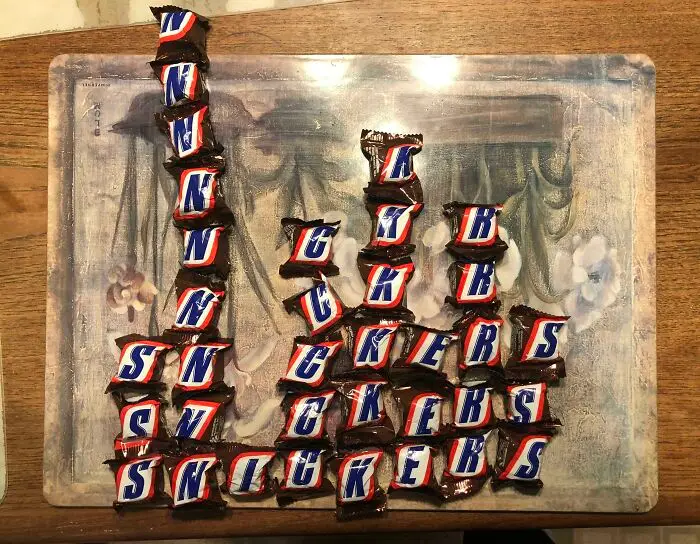
#33 The Popularity Of The Name ‘Karen’ Has Seen A Dramatic Decrease Within The Last Ten Years