






The subreddit r/dataisbeautiful truly lives up to its name. From global or internet trends to societal issues, this community covers it all in easy-to-understand visualizations that effectively convey otherwise complex information. Each graph, chart, or map has the potential to uncover patterns, expose correlations, or shed light on various topics. No wonder why as of today, over 19M people appreciate this subreddit.
So if you feel that sometimes life is just too difficult to comprehend, hopefully, this list will make you feel at least somewhat at ease knowing that even the most complex things can be summed up in a beautiful visualization.
To learn more about data and data analysis, Bored Panda reached out to Matthew Mayo, a Data Scientist and the Editor-in-Chief of KDnuggets, the seminal online resource for Data Science, Machine Learning, AI, and Analytics. Read the full interview with Matthew below.
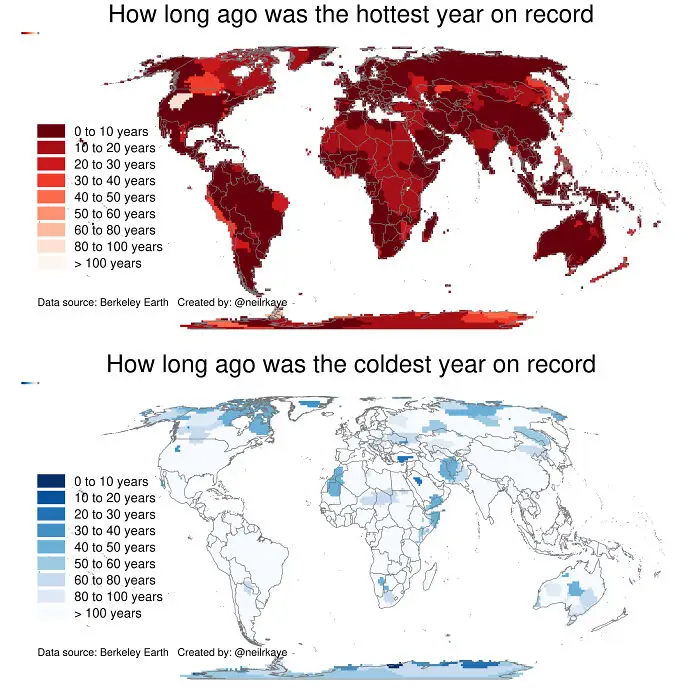
#21 How Long Ago Were The Hottest And Coldest Years On Record Around The World
Report
63points
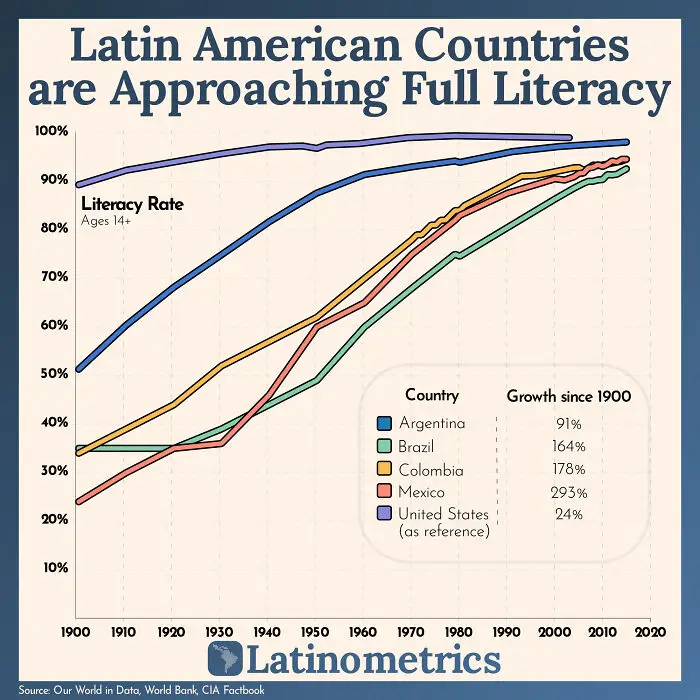
#22 Much Of Latin America Has Caught Up To The 90%+ Literacy Rate The Us Has Had Since 1900
Report
59points
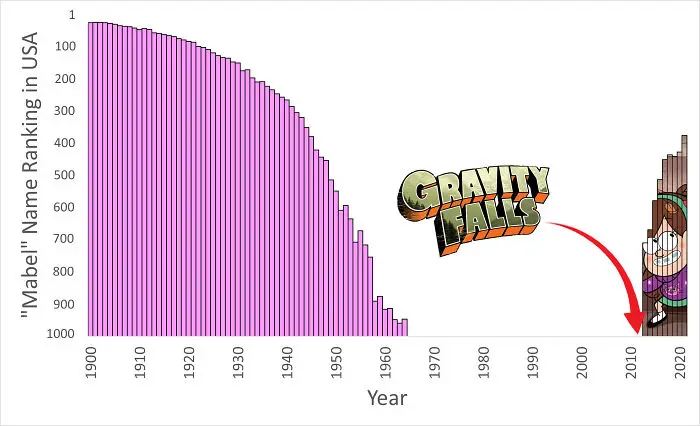
#28 The Popularity Of The Name "Mabel" In The United States Skyrocketed After Gravity Falls Came Out
Report
52points
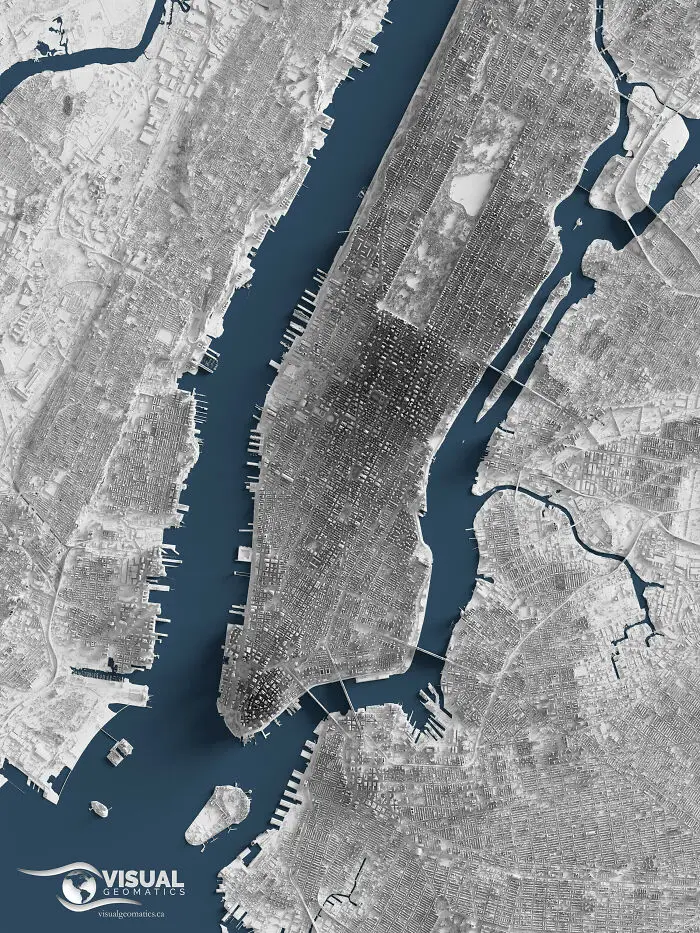
#30 A Detailed Shaded Relief Map Of Manhattan New York Rendered From Lidar Data
Report
51points
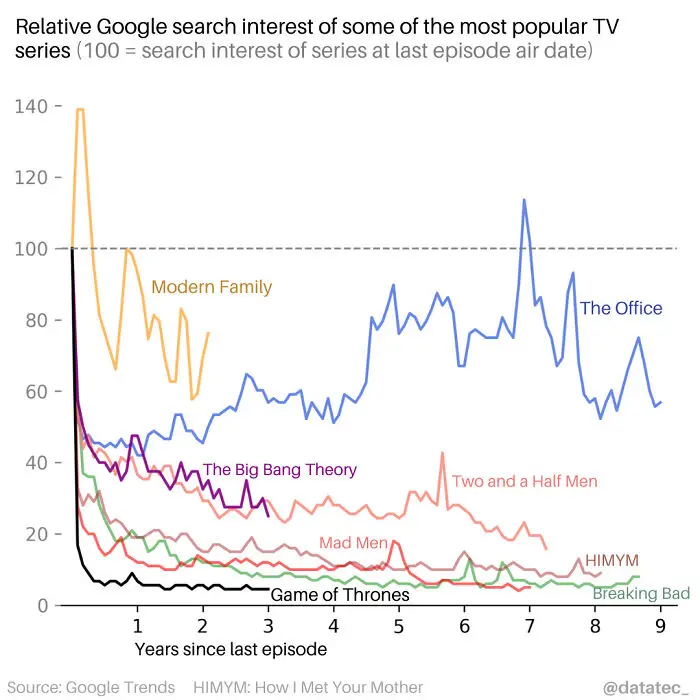
#33 Relative Google Search Interest Of Popular TV Series After Last Episode Air Date
Report
41points
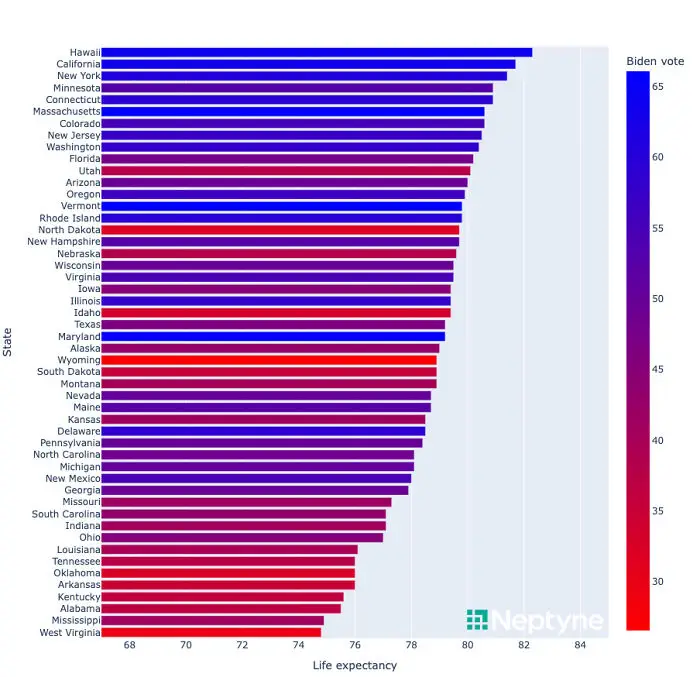
#35 Us States Sorted By Life Expectancy, Colored By Biden's Share Of The 2020 Presidential Election
Report
38points
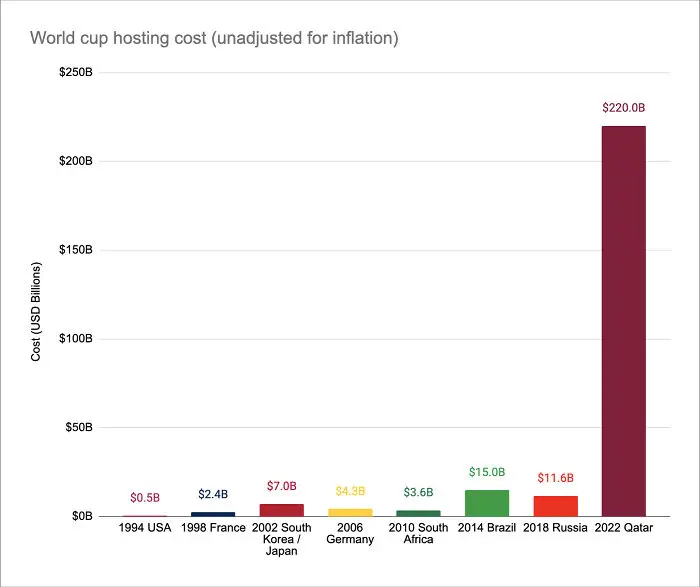
#36 The Cost Of The 2022 FIFA World Cup In Qatar Is Astronomical, Even When Comparing To The Gdp Of The Host Country In The Host Year
Report
38points
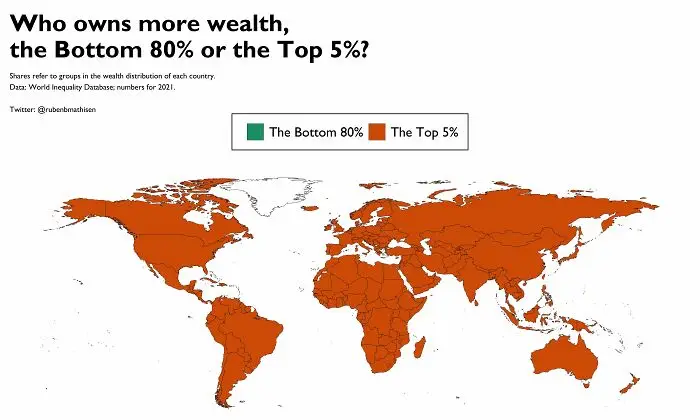
#37 Global Wealth Inequality In 2021 Visualized By Comparing The Bottom 80% With Increasingly Smaller Groups At The Top Of The Distribution
Report
38points
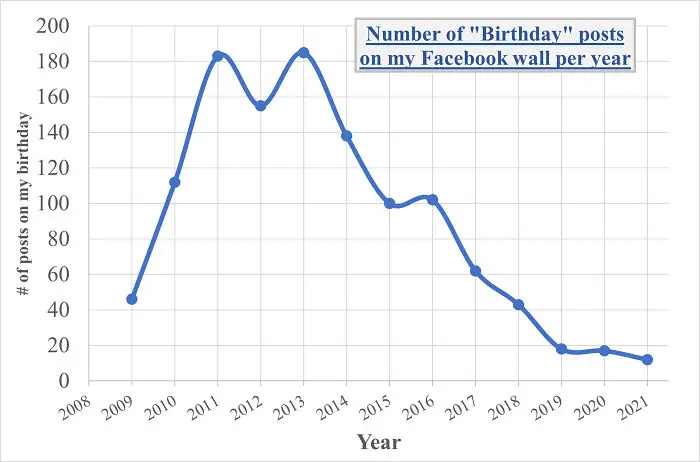
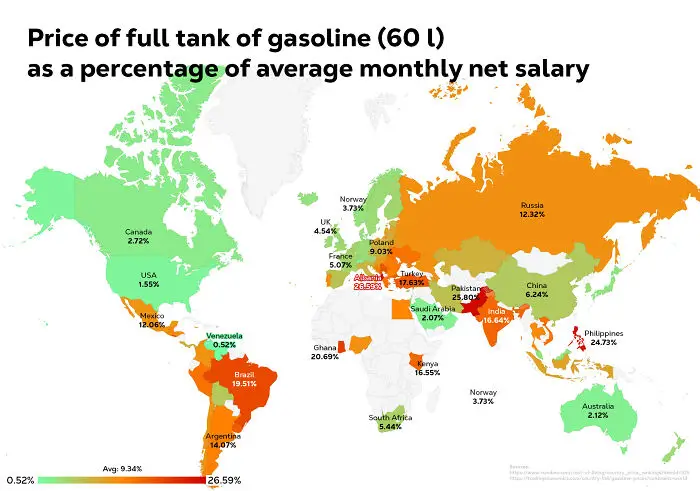
#39 Price Of Full Tank Of Gasoline (60 L) As A Percentage Of Average Monthly Net Salary Across The World
Report
33points
Visual representations in the data science world are crucial, much like the detailed infographic that breaks down the world's languages. Efficient visualizations can communicate complex information easily and are key in data analysis.
For those interested in mastering this skill, understanding how diverse languages are represented visually could provide valuable insights into creating impactful visual data.
