

Bored Panda
30 Countries Compared To The United States With A Real Scale Perspective
CuriositiesMAY 20, 2019

30 Countries Compared To The United States With A Real Scale Perspective

241
99
Maps are deceiving. You see, the surface of a sphere cannot be represented as a plane without some form of distortion.
Since the 1500s, scientists have been developing algorithms that would help transform the globe into something flat, and to do this, they use a method called map projection.
There is no right or wrong way to do it, and everything depends on the map's purpose. But while every type of map preserves one thing, it messes up the other.
Area, shape, direction, bearing, distance, and scale of the landmasses are the main properties map makers are constantly juggling. Most people usually look at the Mercator projection.

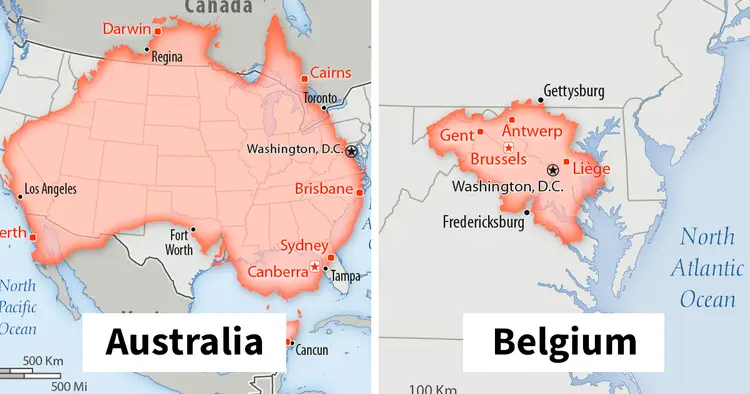
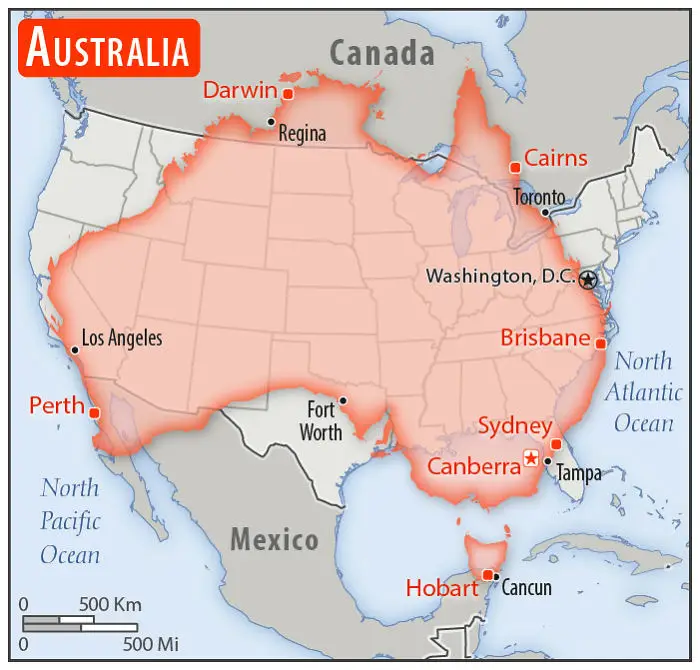
#1 Australia

Australia overlaid on a map of the United States showing size comparison with real scale perspective.
Population: 23,470,145, and all trying to buy a house in Melbourne it seems
84points

The Mercator map is widely used for navigation because it represents lines of constant course. A line drawn between two points on this map would provide the exact angle to follow on a compass to travel between these two points. It also preserves the shape of countries.

However, world maps are less practical because the scale is distorted. And that’s where the Internet comes into play. Imgurian and map lover Mkyner has compiled a series of overlapping maps showing countries from all over the world on top of the United States to give everyone a better understanding of just how huge it is.
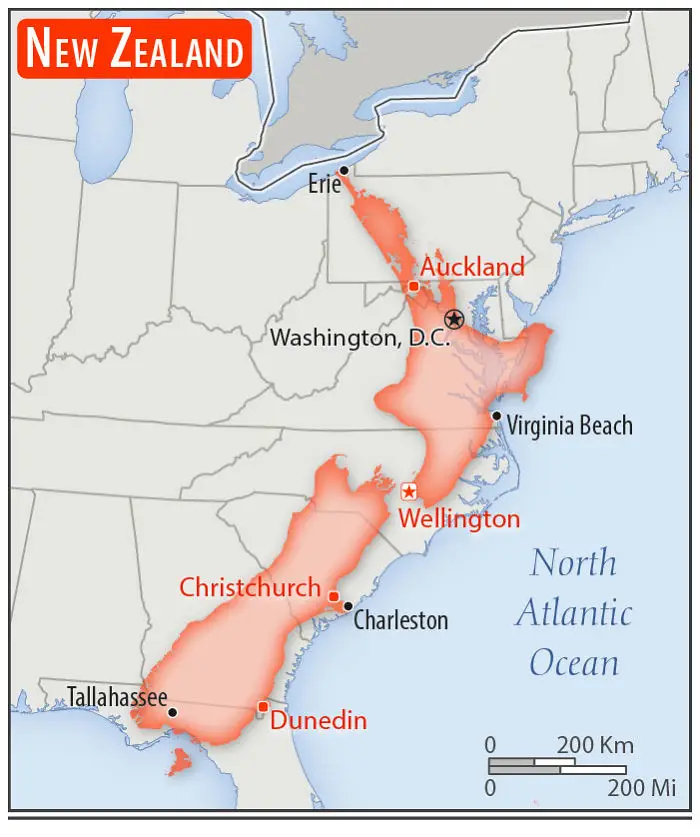
#2 New Zealand

New Zealand compared to the United States showing real scale perspective with cities like Wellington and Auckland highlighted.
Population: 4,545,627 people and about 30,000,000 sheep
69points

Most popular maps are created using cylindrical projection. Imagine putting a cylinder over a globe and projecting each of the points of the sphere onto the cylindrical surface. Then, if you unroll the cylinder, you end up with a flat rectangular map.
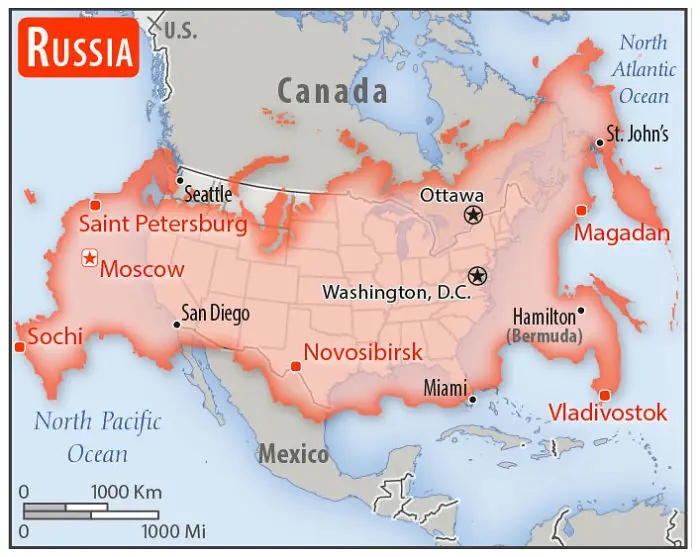
#3 Russia

Russia highlighted over the United States map, showing a real scale perspective comparison of both countries.
Population: 142,122,776
68points

Flemish geographer and cartographer Gerardus Mercator created the Mercator projection in 1569. Gerardus preserved the direction of his map by varying the distances between the latitude lines and making them straight.

However, as with every map, there are drawbacks. For example, Greenland and Africa look about the same size on the Mercator map. However, the actual size comparison to Africa shows that Greenland is smaller. 14 times smaller, to be precise.
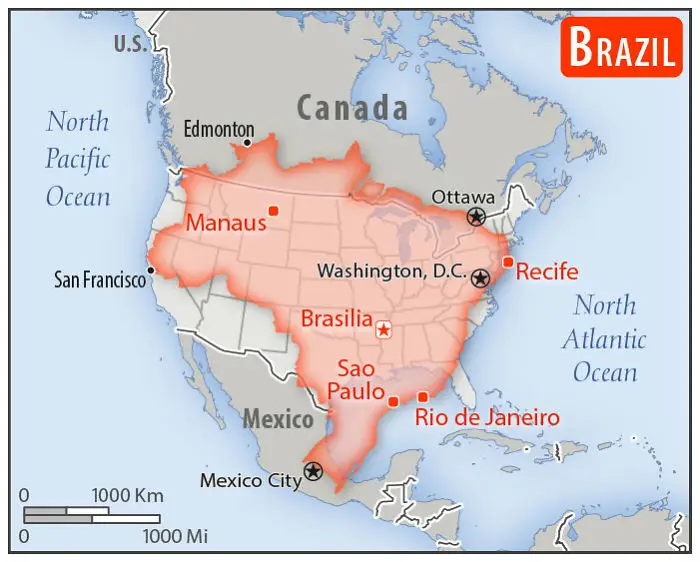
#4 Brazil

Brazil overlaid on the United States map showing real scale perspective and major Brazilian cities compared to US locations.
Population: 208,846,892
60points

However, mapping services like Google Maps still use Mercator. Again, because of its ability to preserve shape and angles. Close-up views of cities and roads are more accurate.

A 90-degree right turn on the map is a 90-degree right turn on the street you’re driving on. And when you’re close-up, the distortion is minimal. If you want, however, a map that shows the actual size of things, fire up one that’s created with a Gall–Peters projection.

#5 India
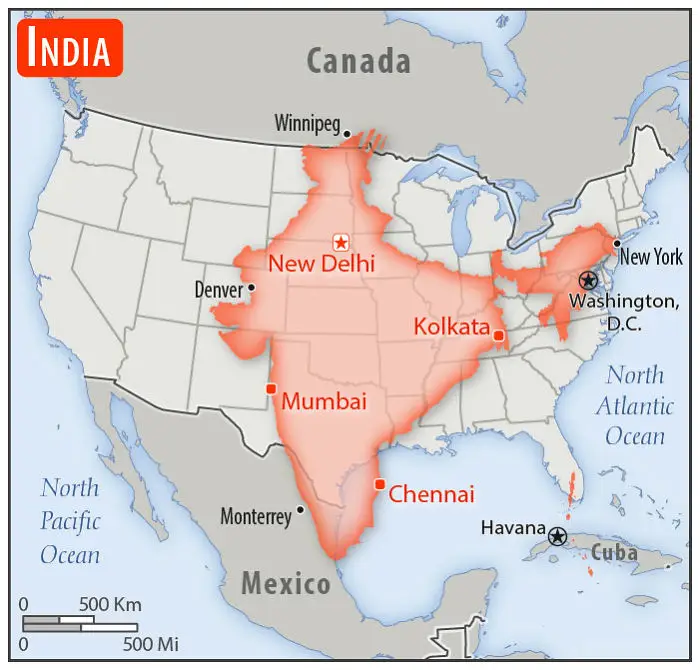
India overlaid on the United States map showing real scale perspective for country size comparison.
Population: 1,296,834,042
Expected to pass China in population within a few years. Stripped bit near Winnipeg is occupied by China.
56points

"I've liked maps for as long as I can remember," Mkyner told Bored Panda. "I enjoy exploring distant places on Google Earth, I think it's important to have an understanding of the countries we hear about in the news, and I love sharing this interest with others (as I think many people do with their hobbies/passions)."
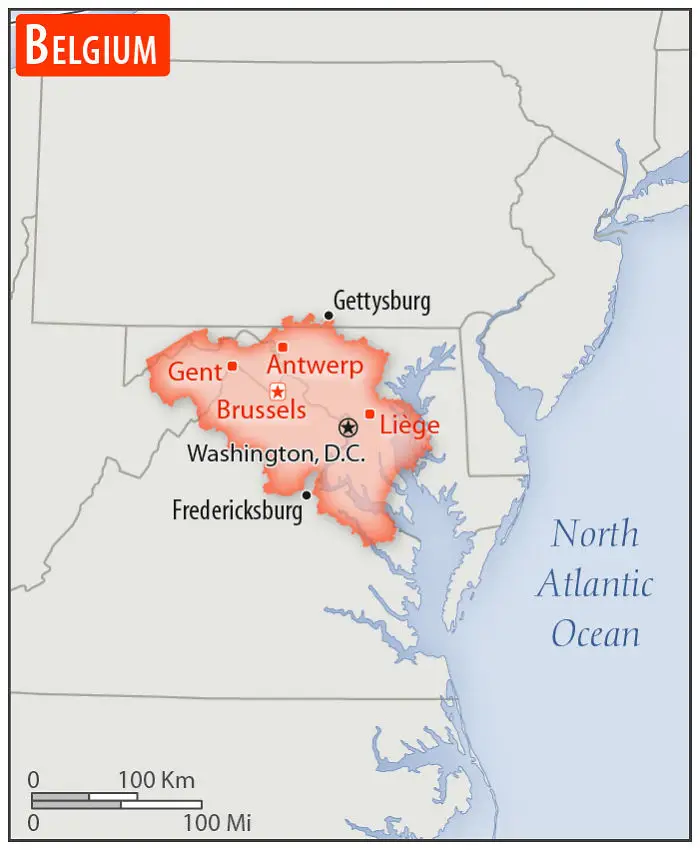
#6 Belgium

Belgium overlaid on the United States map for size comparison with major cities shown, illustrating scale perspective.
Population: 11,570,762
51points

"I was looking up maps of South Africa yesterday (19 May 2019) when I came across the first comparison map. That quickly led to the CIA World Fact Book (a US government source). I was trying to procrastinate on some chores, so compiling those maps into a post seemed like a perfect idea."
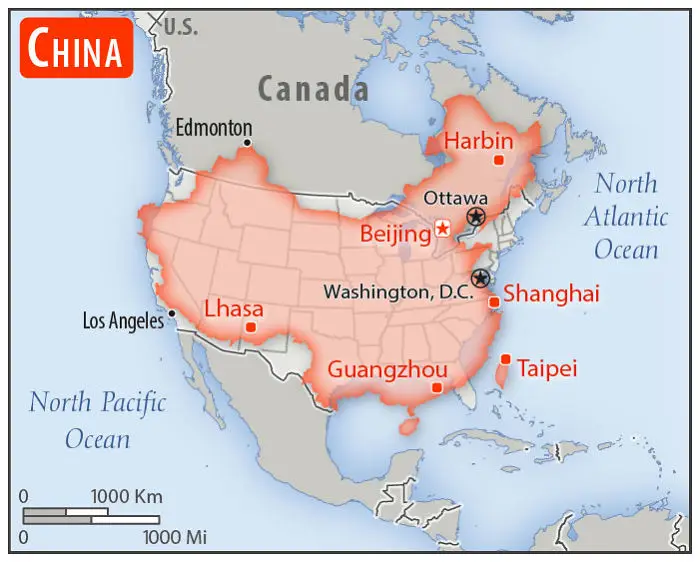
#7 China

China's size compared to the United States shown with major cities and real scale perspective on a North America map.
Population: 1,384,688,986
51points

"Note, I did not include every country in this USA size comparison post," they added. "I skipped Canada and Mexico, since they were on a lot of the maps anyway, and some of the smaller/more obscure countries (think Togo and Kyrgyzstan)."

#8 Indonesia
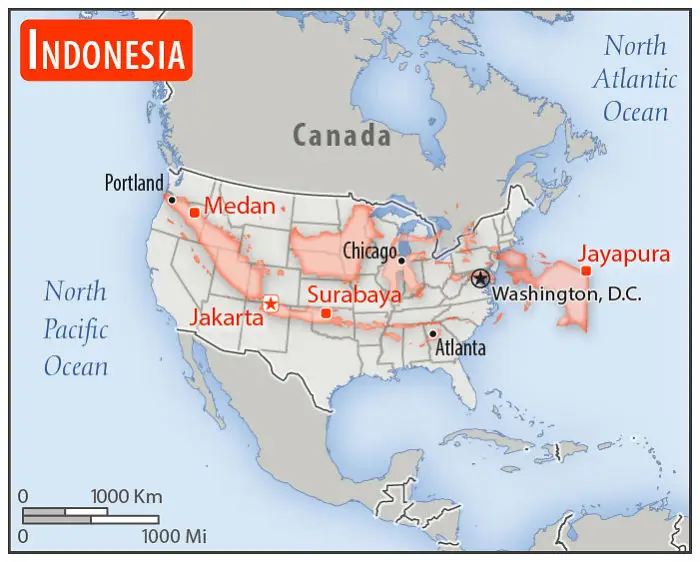
Map showing Indonesia compared to the United States with real scale perspective highlighting major cities locations.
Population: 262,787,403
More than half the population is on that one island running from northern New Mexico to central Oklahoma. The big island in the upper Great Plains and that thing in the Atlantic are mostly jungle.
51points

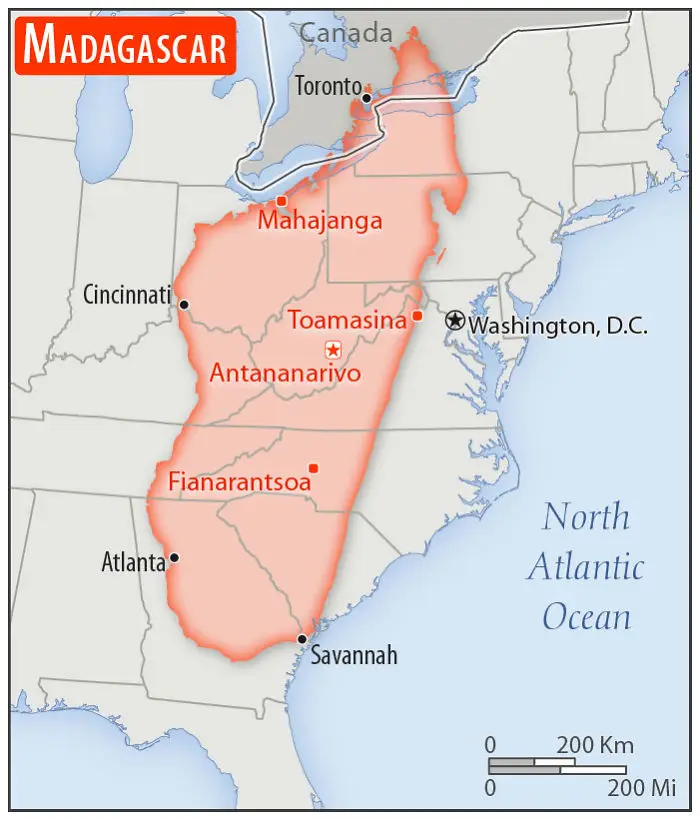
#9 Madagascar

Map showing Madagascar overlaid on the United States with real scale perspective comparing 30 countries.
Population: 25,683,610
Ports: closed.
50points

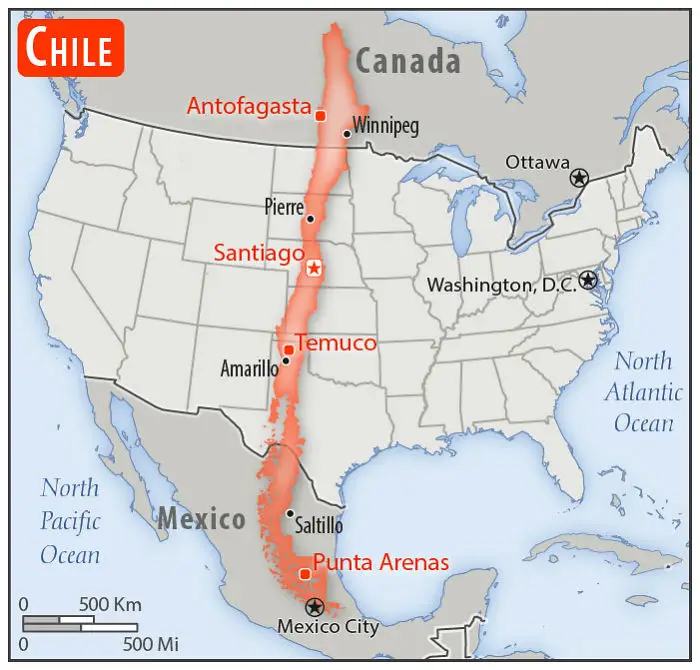
#10 Chile

Chile compared to the United States showing real scale perspective from north to south across the map.
Population: 17,925,262
47points

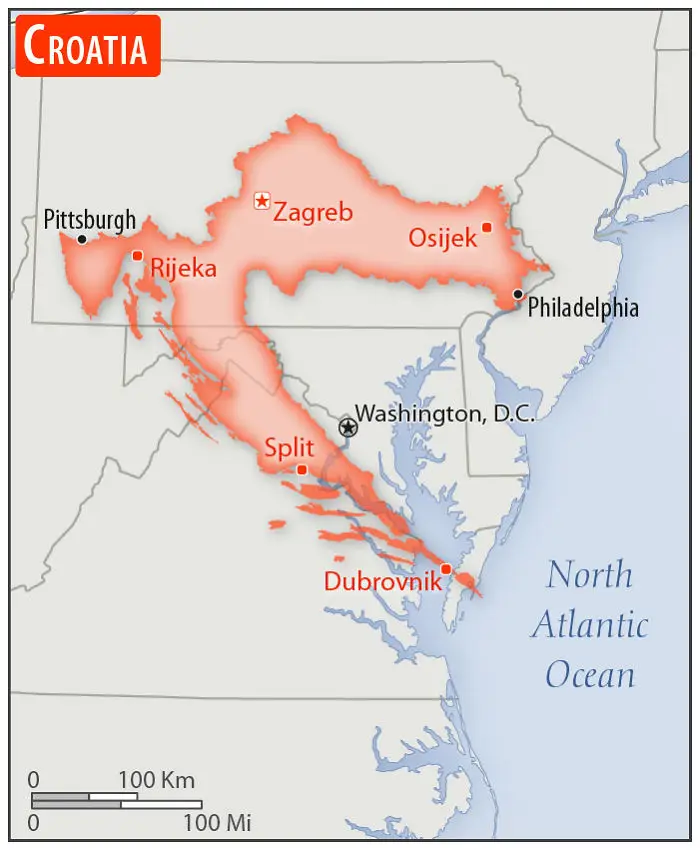
#11 Croatia

Map showing Croatia overlaid on the eastern United States, illustrating real scale perspective comparison to the US.
Population: 4,270,480
One of the coolest-shaped countries, like a Needler from Halo.
41points

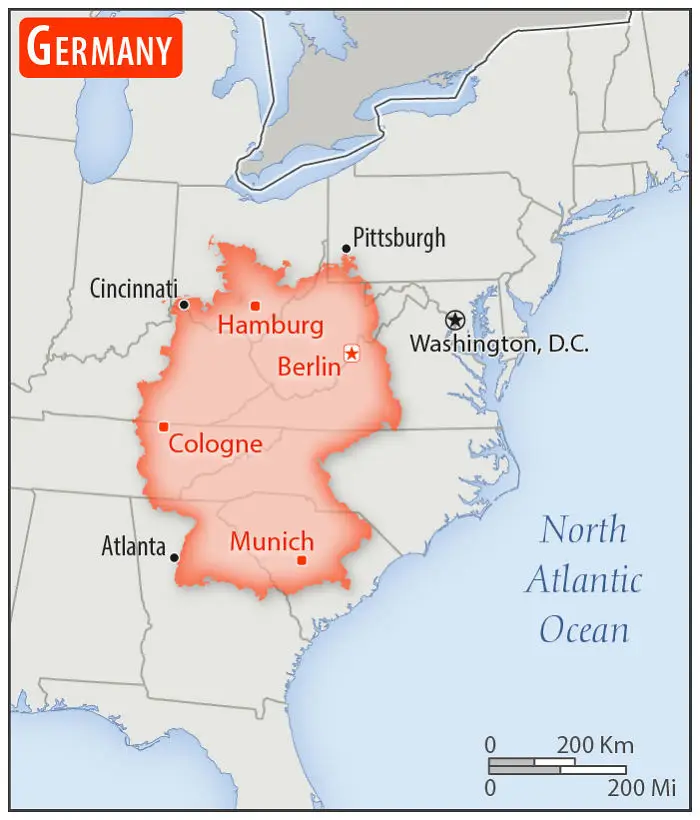
#12 Germany

Germany highlighted on a real scale map compared to the United States showing major cities and geographic locations.
Population: 80,457,737
40points

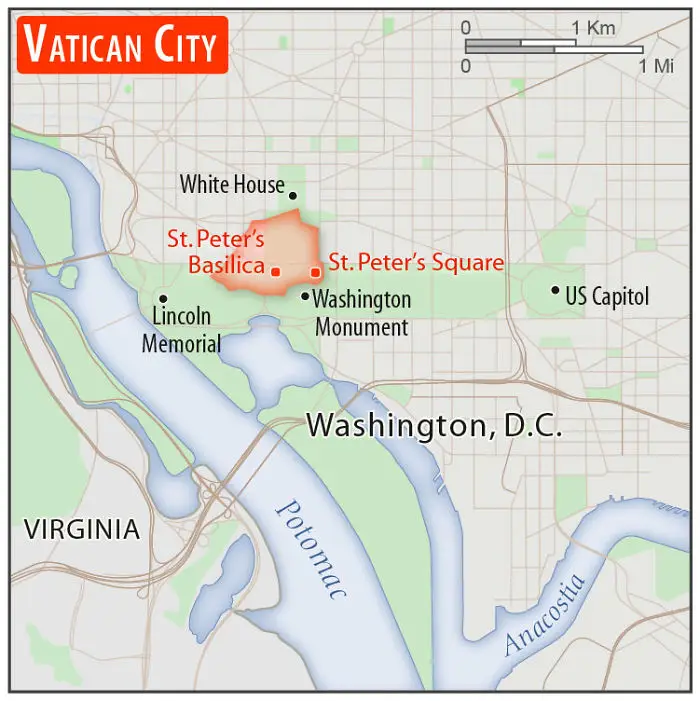
#13 Vatican City

Map showing Vatican City compared to Washington, D.C., illustrating real scale perspective in countries compared to the United States.
Population: 1,000
aka Holy See
38points

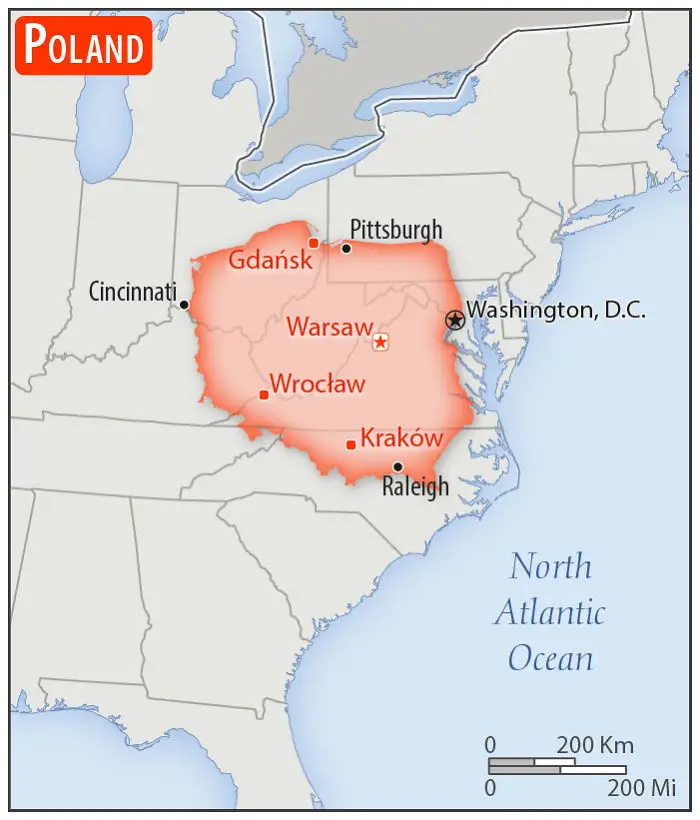
#14 Poland

Map showing Poland overlaid on the United States to compare size with a real scale perspective.
Population: 38,420,687
37points

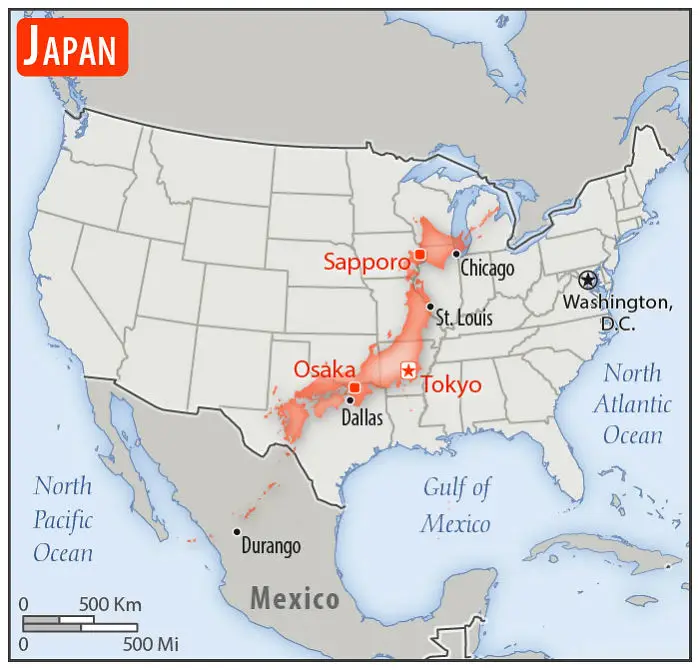
#15 Japan

Japan overlaid on a US map showing real scale perspective with major cities like Tokyo, Osaka, and Sapporo highlighted.
Population: 126,168,156 and 1 Godzilla
Bullet train will take you from Tokyo, Arkansas to Osaka, Texas in about 2.5hrs
36points

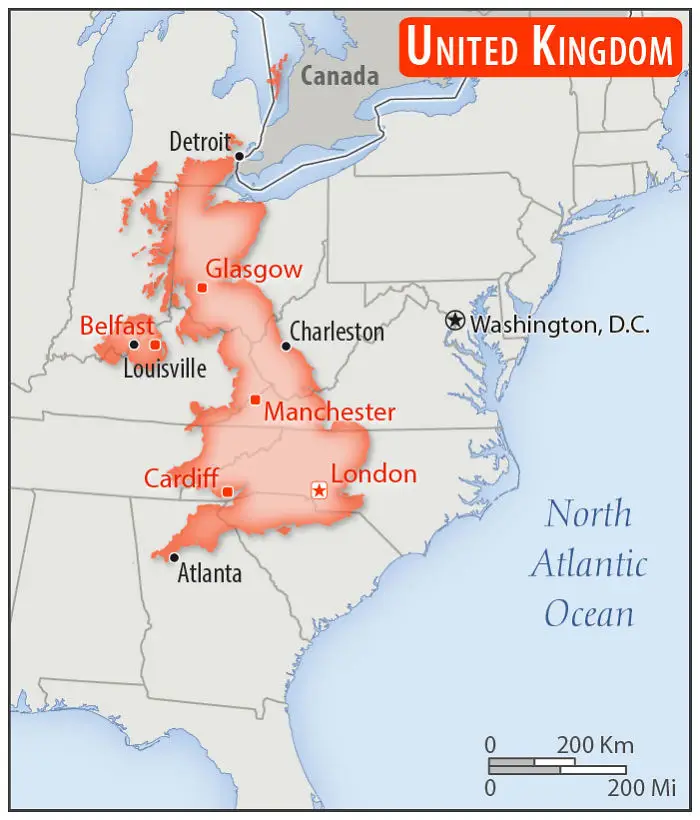
#16 United Kingdom

Map showing the United Kingdom compared to the United States with a real scale perspective across several states.
Population: 65,105,246
36points

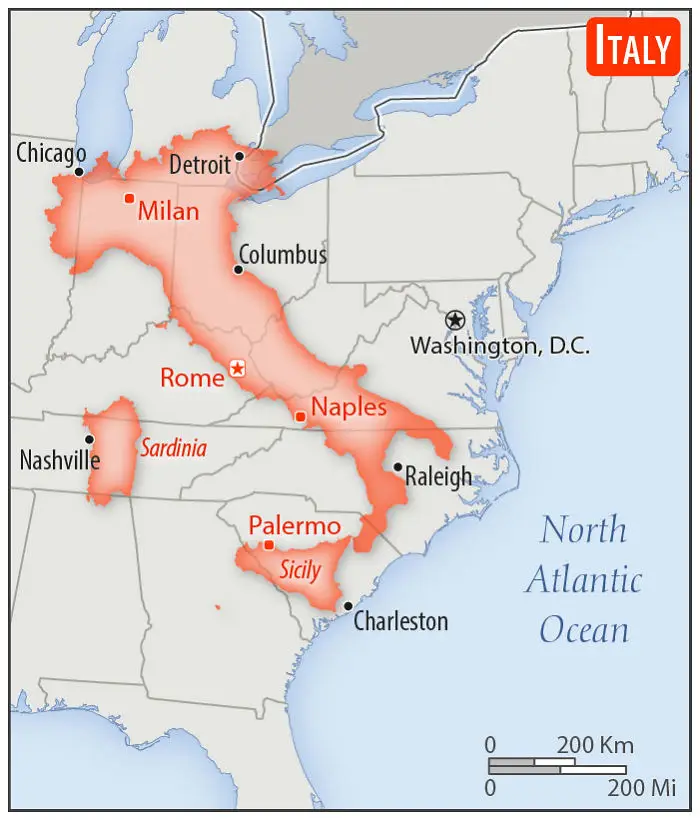
#17 Italy

Italy overlaid on the eastern United States showing a real scale perspective comparison between countries and the US.
Population: 62,246,674
Giving South Carolina the boot.
35points

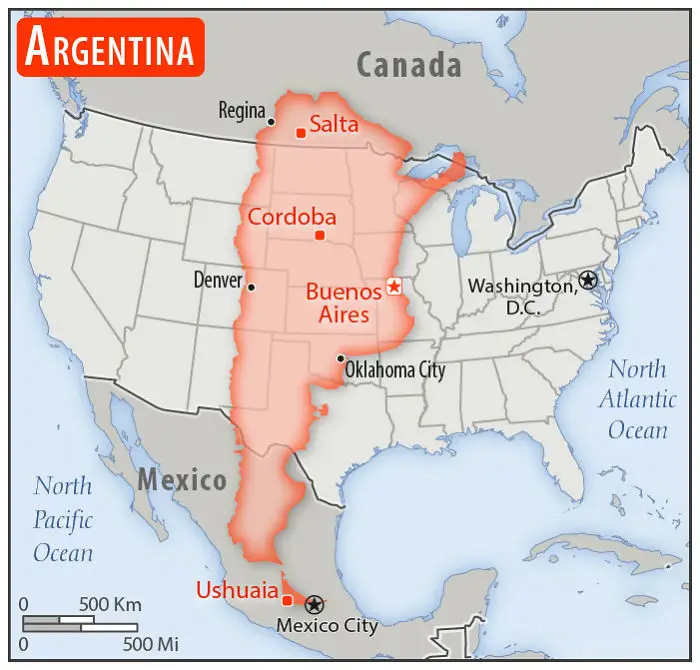
#18 Argentina

Map showing Argentina overlaid on the United States to compare country sizes with a real scale perspective.
Population: 44,694,198
32points

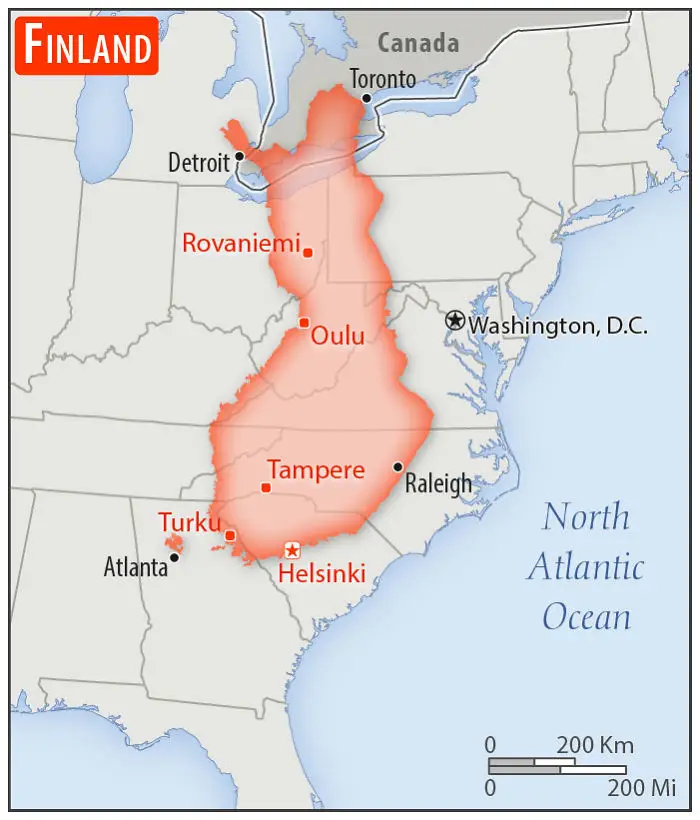
#19 Finland

Finland overlaid on eastern United States showing real scale perspective comparison between countries.
Population: 5,537,364
May or may not exist.
32points

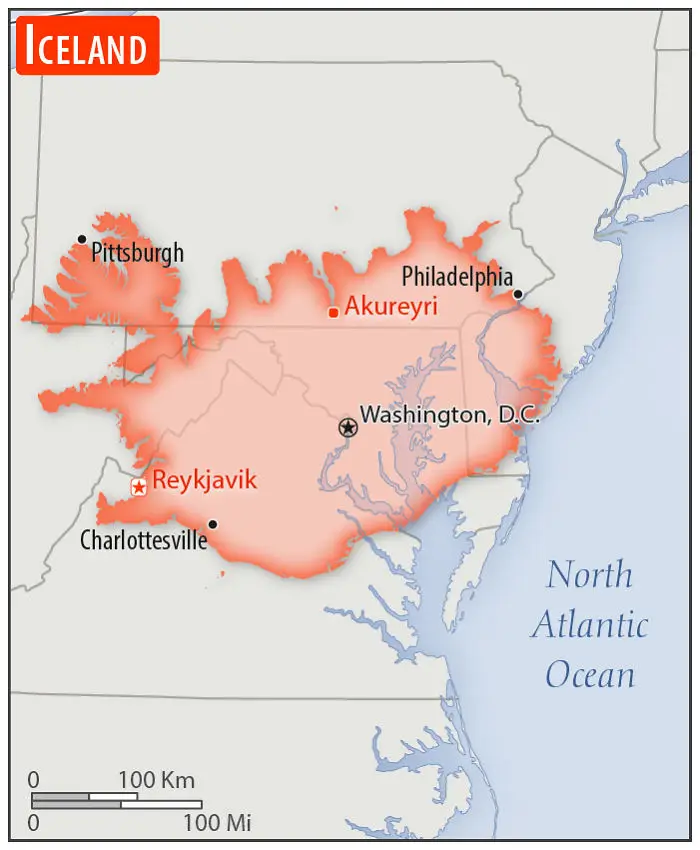
#20 Iceland

Iceland's real scale compared to the United States highlighting major cities and geographic overlap on the East Coast.
Population: 343,518
32points
241
99